Decoding the Compiler: A Deep Dive into the Phases of C Code Compilation
11 min read
February 24, 2023

Introduction
In our previous chapter, we quickly touched upon the intriguing process of binary compilation. This time, we’re diving deeper and getting our hands dirty with some real testing using the gcc compiler. Our goal? To understand the compilation process in its full glory, right down to the nitty-gritty details. For this adventure, we’ll be working with a neat piece of C code, dissecting it through each phase of the binary compilation process. Here’s the code we’ll be playing with:
//main.c

#include <stdio.h>
#define FORMAT_STRING "%s"
#define MESSAGE "Hello, world!\n"

int main(int argc, char *argv[]) {
	printf(FORMAT_STRING, MESSAGE);
	return 0;
}
In this chapter, we’re spicing things up by introducing two new phases: the preprocessing phase and the linking phase. So, get ready for an updated journey through the C Compilation process, where we’ll uncover more secrets and enhance our understanding of what really goes on under the hood.
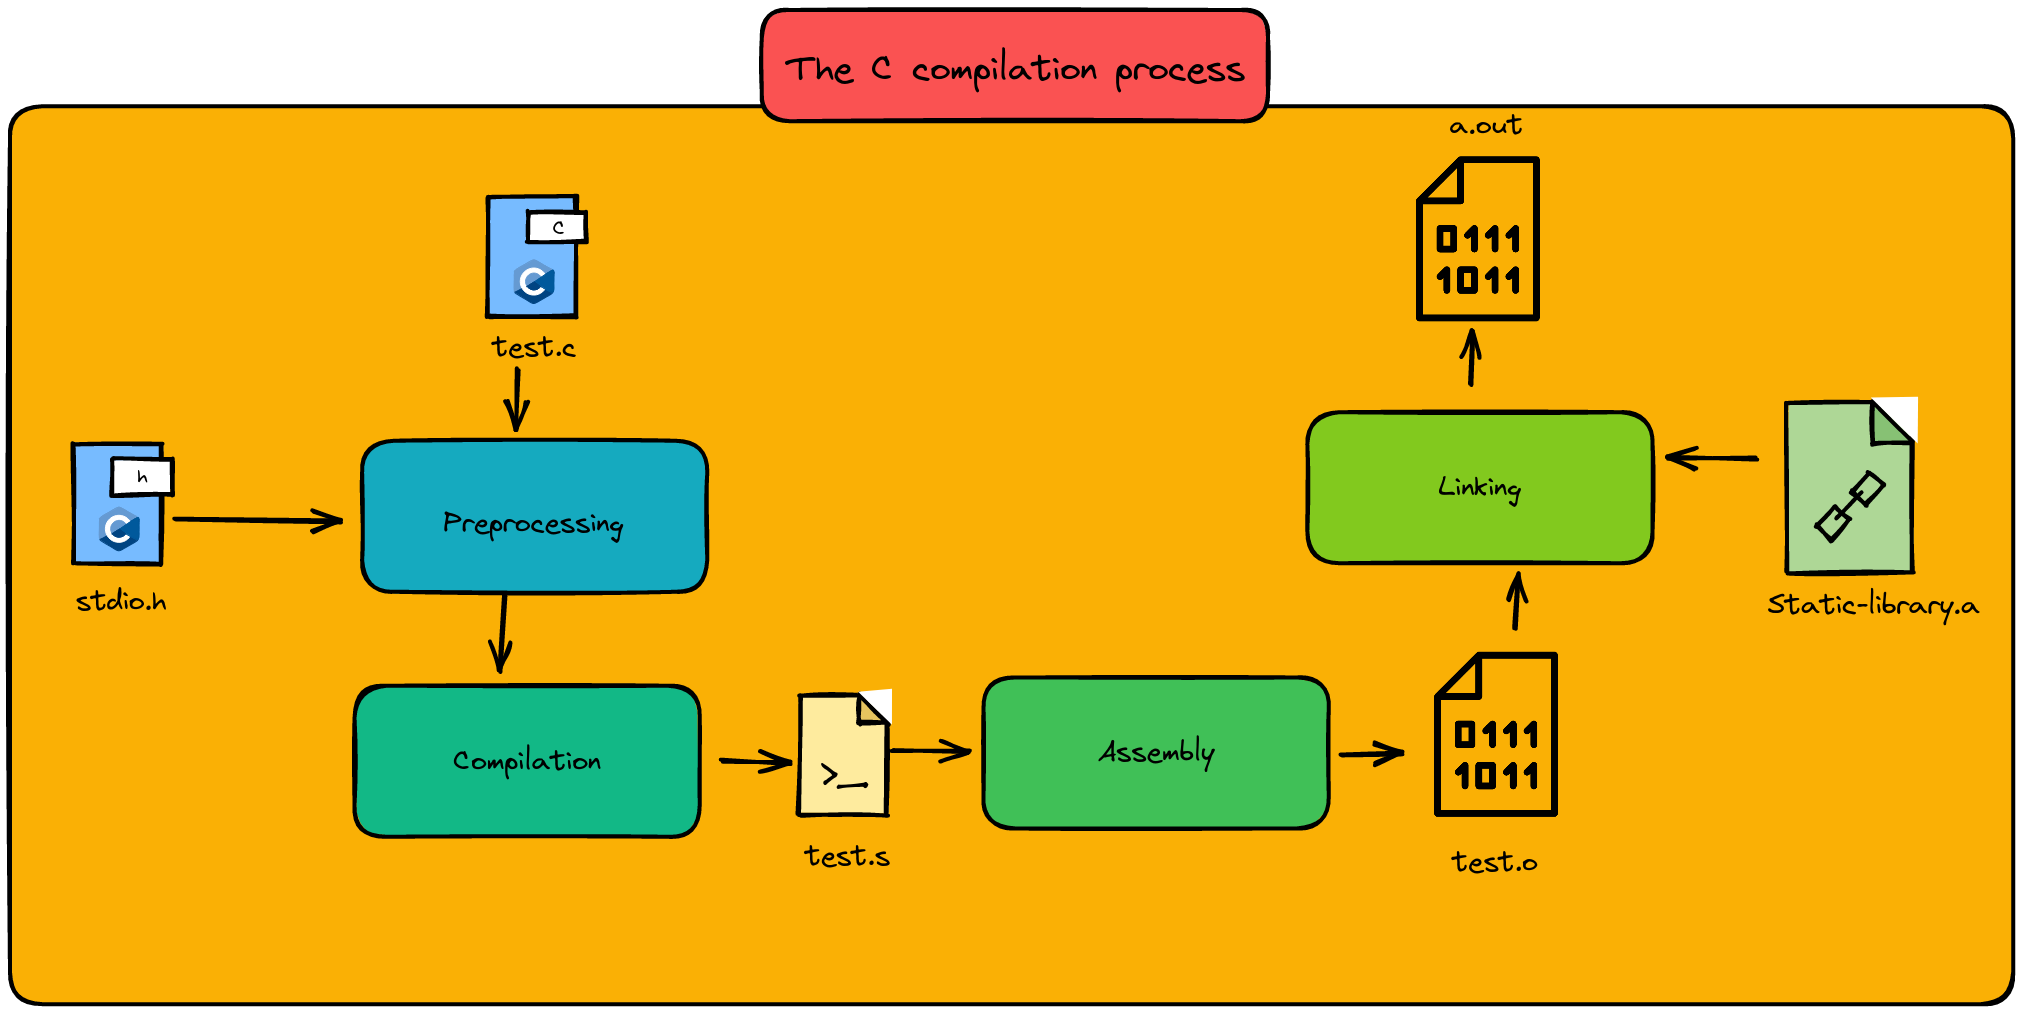
The C Compilation process
The Preprocessing Phase: Setting the Stage for Code Magic
Think of the preprocessing phase as the behind-the-scenes magic in the world of coding. It’s like preparing the ingredients before cooking a meal. In this phase, what we’re essentially doing is gathering all the necessary functions and macros from header files (like our good old friend stdio.h) and mixing them into our source code recipe. Why, you ask? Well, it’s simple - our code needs these ingredients to perform functions like printf, the culinary equivalent of making our code ‘speak’.
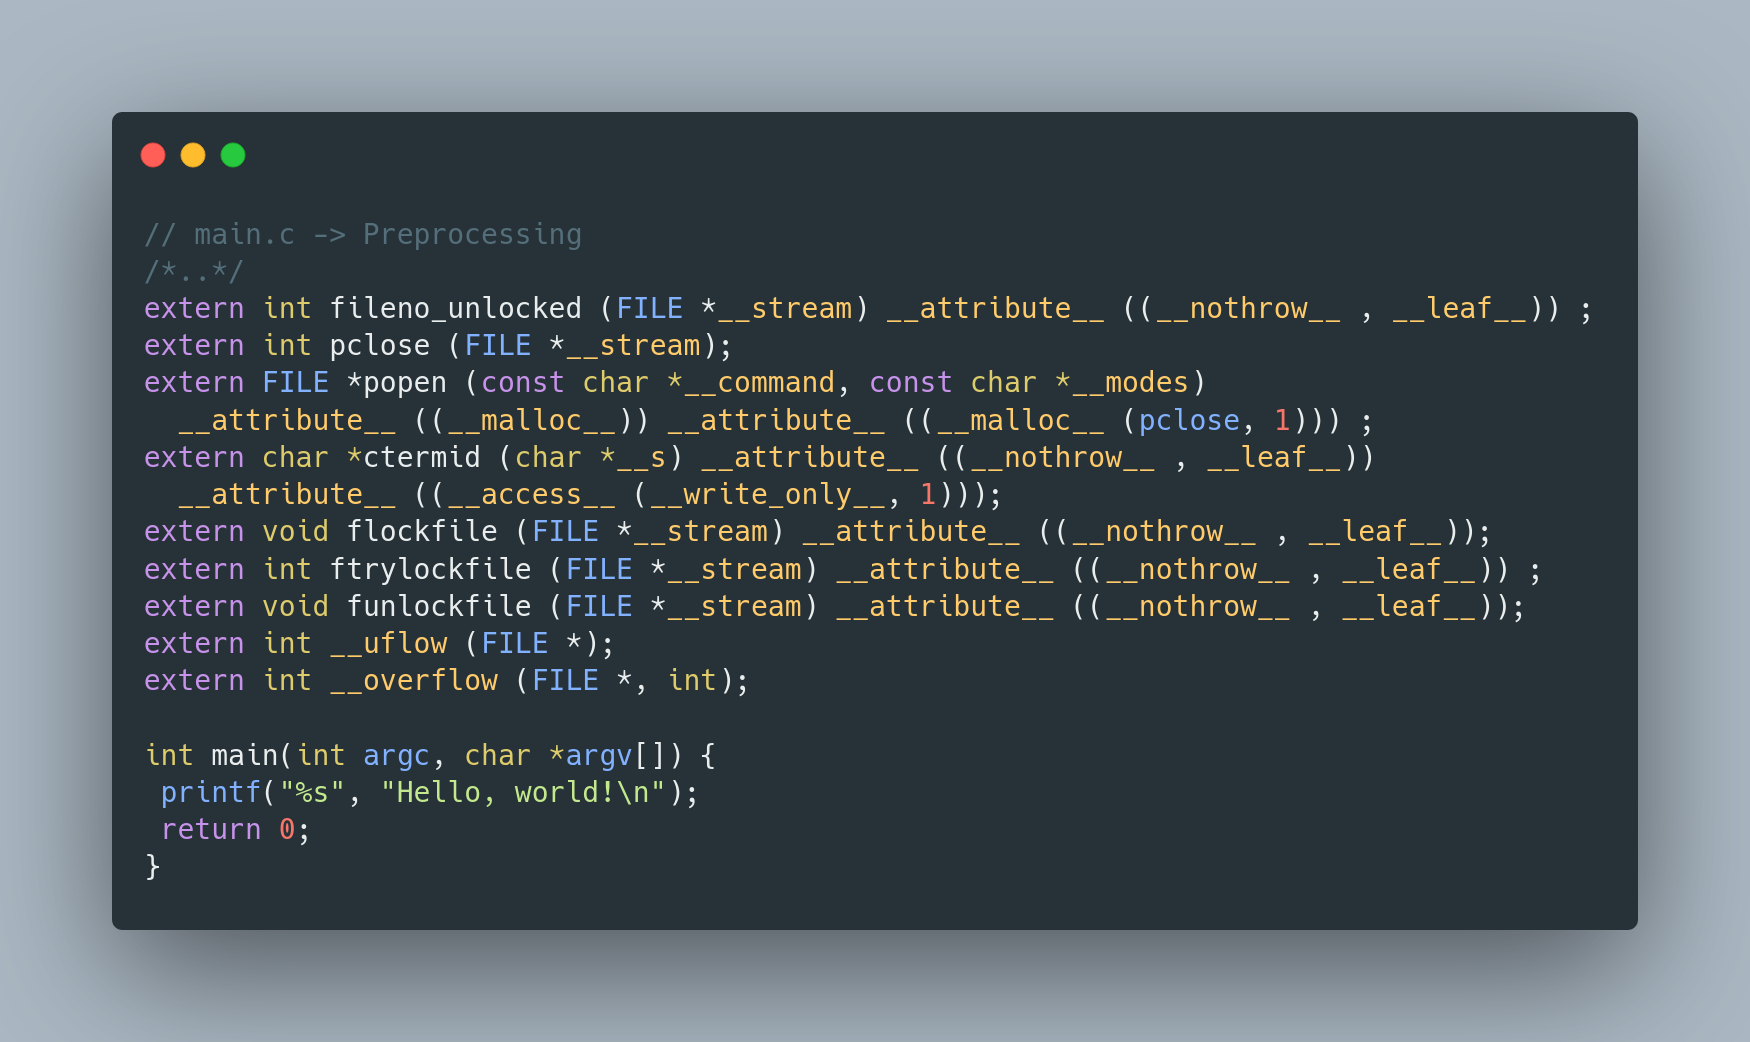
Code sample after preprocessing phase
Let’s peek into our main.c - notice how it’s now fully equipped with all the stdio function headers? That’s preprocessing for you, ensuring our code has everything it needs to execute successfully. Also, take a glance at how the FORMAT_STRING and MESSAGE macros are no longer just declarations; they’re now part of the actual printf function. Pretty neat, right?
Now, how do we whip up this preprocessing magic using gcc? Just use this simple command:
gcc -E -P test.c
Here, -E is your stop sign, telling gcc to pause right after preprocessing. And -P? That’s your neat filter, keeping those debugging messages out of your way.
So, there you have it - the preprocessing phase, where our code begins to take shape, ready for the culinary art of programming!
The Compilation Phase: From C to Assembly
Welcome to the compilation phase, where our C code embarks on a transformative journey, morphing into assembly code. Imagine this phase as a meticulous translator, converting our high-level C language into a form that’s closer to the machine’s heart - assembly language.
But that’s not all. Here, our compilers play the role of savvy editors, making optimizations to our code. These tweaks and tunings can lead to subtle yet impactful changes in the final assembly code - kind of like fine-tuning a recipe to perfection.
To navigate through this phase with gcc, we use a special set of commands:
gcc -S -masm=intel compilation_example.c
-S here is our trusty guide, ensuring that the journey ends right after the compilation, with the results neatly saved. The -masm=intel? That’s like choosing the dialect of assembly language we prefer, opting for the Intel syntax in our case.
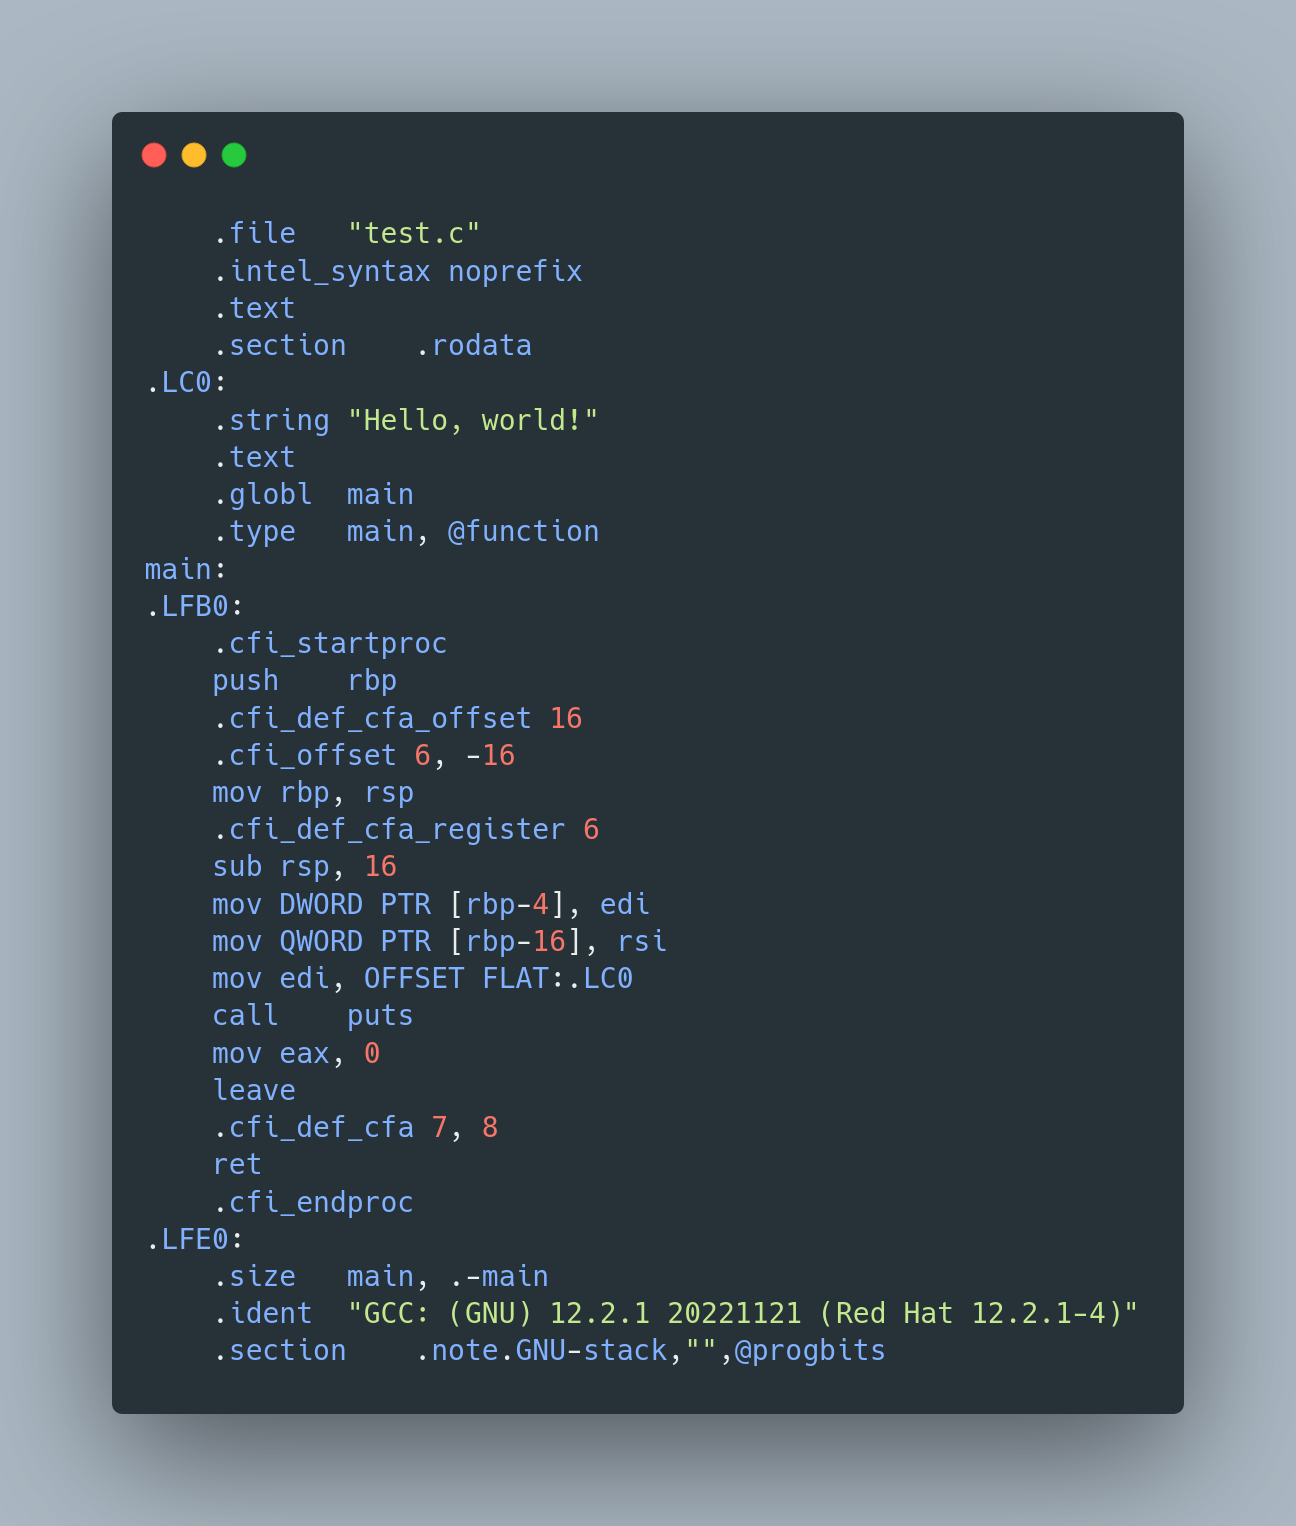
Intel Assembly Code
Now, let’s peek into the world of assembly code. We don’t need to dive too deep, but even at a glance, you can see the magic at work. Notice the label for our main function? That’s our code, now in assembly attire. And look there! The string “Hello, world!” has its own label - .LCO. Drawing from our past chapters, we can even start to distinguish between the prologue and epilogue parts of a function.
The Assembly Phase: Crafting the Object File
Now, we step into the assembly phase, where our code undergoes a remarkable transformation. It’s like a caterpillar turning into a butterfly, but in the world of programming. Here, the assembler code, which is already close to the language of machines, is converted into pure machine code. This is the creation of what’s known as the “object file” or “module”.
To bring this object file to life using gcc, here’s the magic spell:
gcc -c compilation_example.cThe -c flag is our little helper in this process, dedicated to generating the object file.
But how do we really know what we’ve created? Enter the file command, a window into the nature of our compiled file:
[rsgbengi@kaysel binary]$ file test.o
test.o: ELF 64-bit LSB relocatable, x86-64, version 1 (SYSV), not stripped
And it speaks! The output tells us that test.o is an “ELF 64-bit LSB relocatable, x86-64, version 1 (SYSV), not stripped”. Let’s decode this, shall we?
- ELF 64 bit: Think of this as the DNA of our file – it’s in the Executable and Linkable Format for 64-bit systems.
- LSB: This stands for ‘Least significant byte first’, a way our data is ordered – it’s the little-endian format.
- Relocatable: Unlike a rigid statue, these files are flexible – they don’t need a fixed spot in memory to exist. This is what sets an object file apart from an executable.
Here’s the kicker: since these files are compiled independently, their memory addresses are like unknown variables during the assembly phase. That’s why they need to be relocated in memory, or ‘linked’, so they can come together to form a complete executable.
So, in the assembly phase, we’re not just building parts; we’re preparing them for the grand assembly, where they all come together to form something greater.
The Linking Phase: Where Everything Comes Together
Welcome to the grand finale of our compilation process - the Linking phase. Picture this as the moment where all the individual pieces of a puzzle find their place, creating a complete picture. In this phase, all the object files we meticulously crafted in the assembly phase are brought together, and voilà, an executable is born!
But who’s the mastermind orchestrating this grand assembly? Enter the linker - the program that takes the baton from the compiler after its job is done. The linker is a bit like a conductor, seamlessly connecting various sections of an orchestra to create a harmonious symphony.
Here’s where things get interesting: as the linker binds these object files, it also needs to make sense of references to variables and functions from other libraries. But there’s a catch - the exact memory addresses of these functions and variables are like puzzle pieces hidden under the couch. They’re unknown at this point.
This is where relocation symbols come into play. These symbols are like clues in a treasure hunt, guiding the linker on how to resolve each variable or function. When an object file depends on these relocation symbols to find its references, we call this a symbolic reference. It’s a bit like saying, “I know what I need, but I need some help finding out where it is.”
So, in the linking phase, it’s not just about bringing parts together; it’s about ensuring they communicate and connect correctly, setting the stage for the final, runnable program.
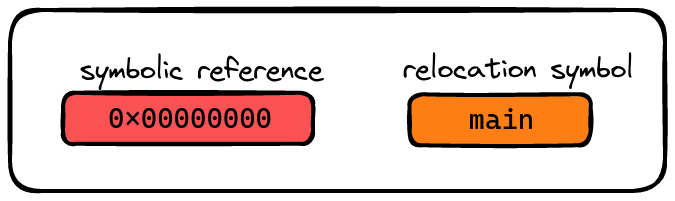
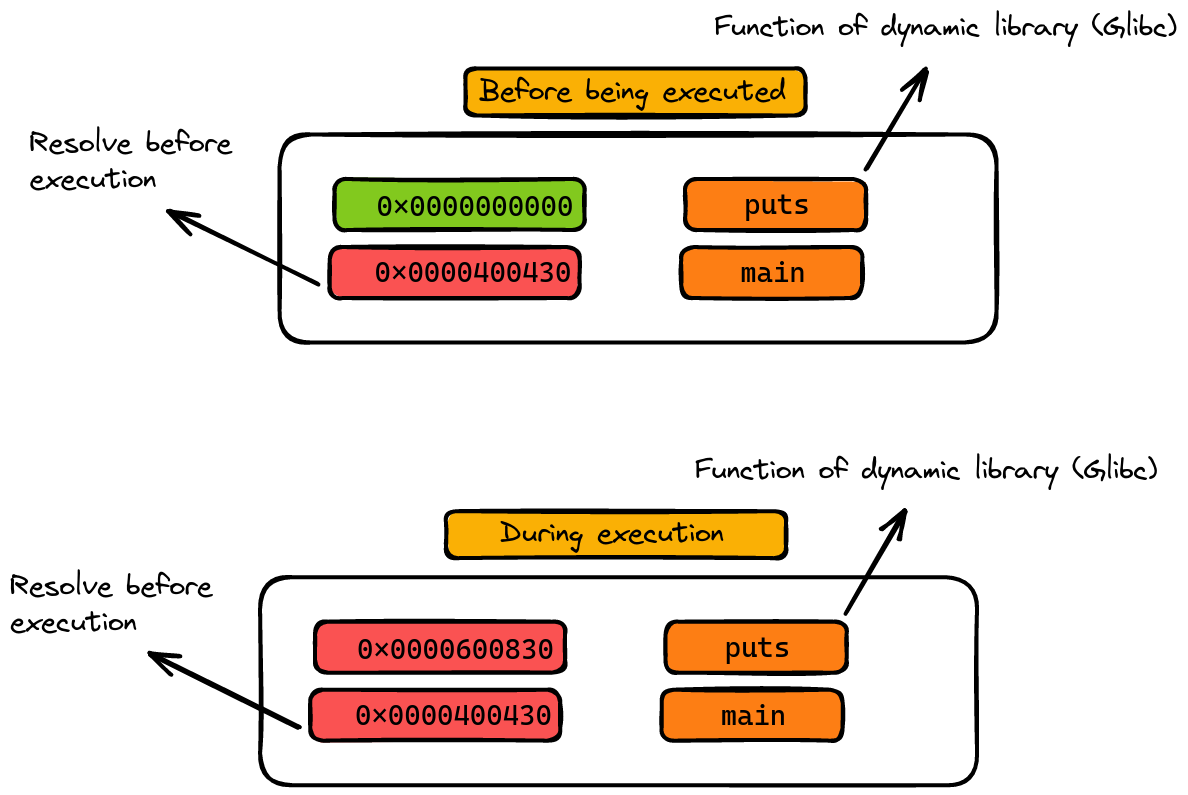
Symbolic reference vs relocation symbol
Static vs Dynamic Libraries: The Final Touch in Linking
Once our linker has masterfully assembled all the pieces into a single executable, it’s time for the grand resolution. Imagine this part as the final polish on a newly built sculpture. Here’s where the magic of static and dynamic libraries comes into play.
First, let’s talk about static libraries. These are like loyal friends who are always there for you. When the linker encounters references to static libraries, it resolves them completely, integrating their code directly into the executable. It’s a bit like embedding all the ingredients into the cake before baking.
Dynamic libraries, on the other hand, are the social butterflies of the library world. They don’t get fully resolved in the executable. Instead, they remain as symbolic references, akin to placeholders. Why? Because, unlike static libraries, dynamic libraries are loaded into memory just once, and this happens when the executable is run. It’s like calling a friend to join the party at the right moment. These libraries are ‘shared’ across different programs, hence the name.
Sample of resolutions
Now, to bring our compiled code to life with gcc, here’s what we do:
[rsgbengi@kaysel] gcc test.c
[rsgbengi@kaysel] file a.out
a.out: ELF 64-bit LSB executable, x86-64, version 1 (SYSV), dynamically linked, interpreter /lib64/ld-linux-x86-64.so.2, BuildID[sha1]=e10050d173339c7473395a453a2a90fd6fa868a9, for GNU/Linux 3.2.0, not stripped
And there it is: a.out, our ELF 64-bit LSB executable, dynamically linked and ready for action. By default, gcc names the output a.out, but if you’re feeling creative, you can give it a custom name using the -o flag.
Let’s decode the identity of a.out:
- ELF and LSB: Just as in the assembly phase, these terms describe the format and data ordering of our executable.
- Executable: It’s no longer just relocatable; now, it’s a full-fledged executable, ready to run.
- Dynamically linked: This means our executable is using those dynamic, social libraries.
- Interpreter: The dynamic linker steps in here, resolving memory addresses of functions and variables from the dynamic library.
- Not stripped: The binary retains symbols, which are like helpful notes, making debugging and understanding the executable easier.
Symbols: The Compiler’s Glossary
In the world of programming, ‘symbols’ are like the nicknames that a compiler gives to various functions and variables after it’s done compiling the code. They’re not just names, though. These symbols are intricately linked to their corresponding data and binary code, forming a crucial part of the program’s DNA.
Imagine you’ve written some C code. Now, to see these symbols in action, we can use a tool like radare2, a Swiss Army knife for reverse engineering. We’ll explore radare2 more in future articles, but for now, here’s a sneak peek:
rardare2 test
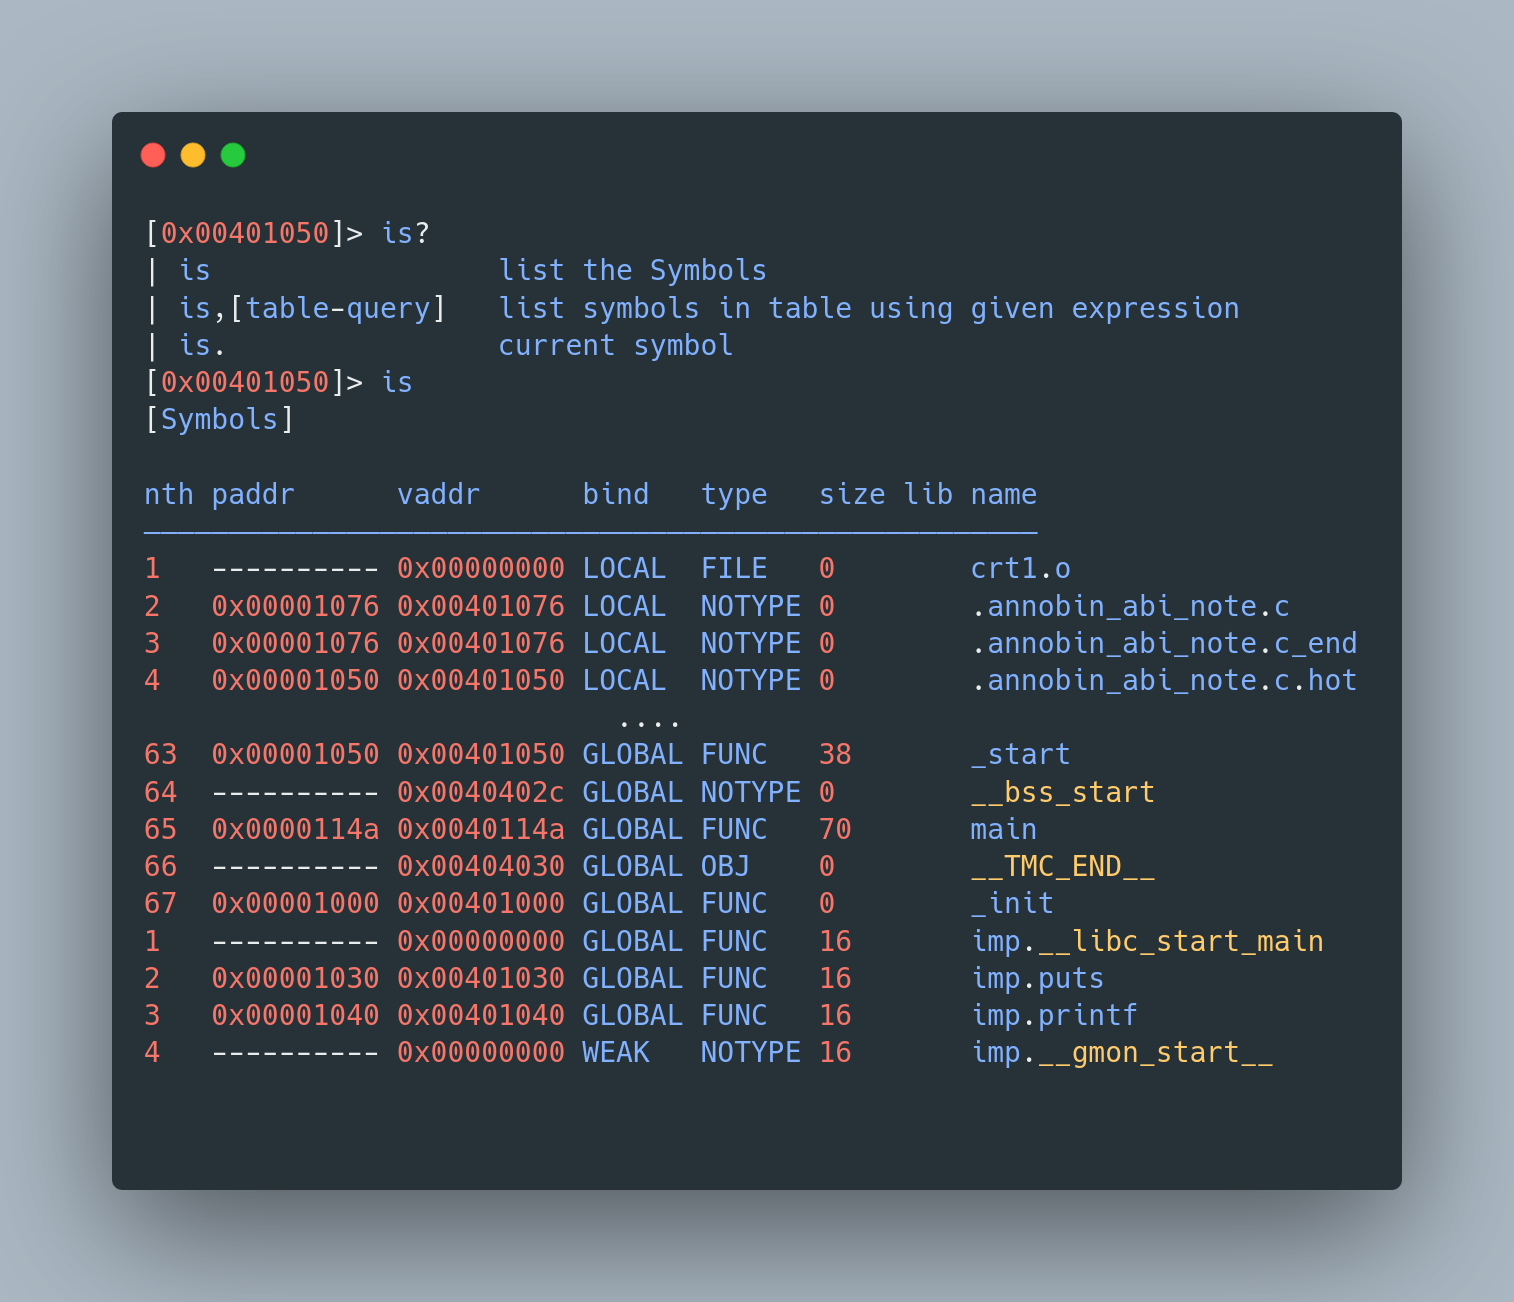
Symbols of the executable
Alternatively, for a more traditional route, we can turn to the Linux readelf command. This handy tool lets us peek into the symbol universe of our compiled code. Here’s how it works:
readelf --syms test
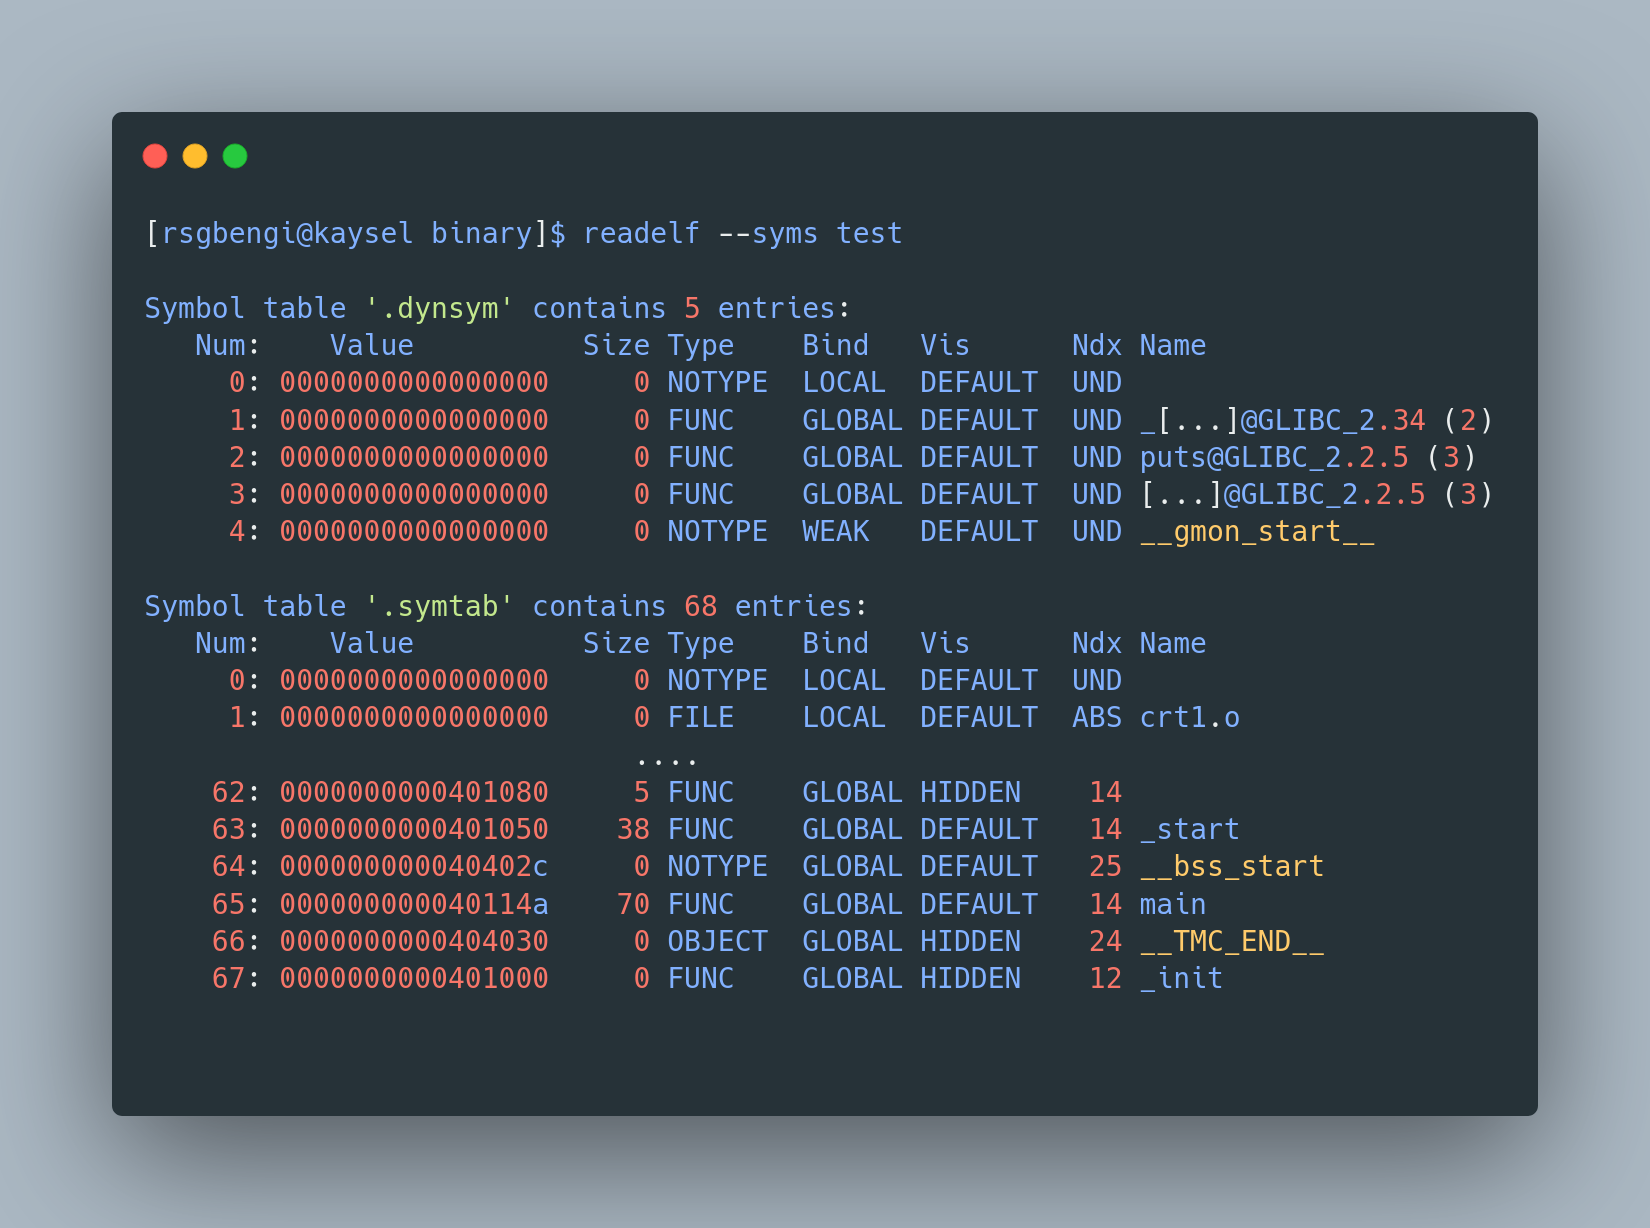
readelf to show the symbols of the executable
Reading the output is like decoding a secret message. You’ll see the main symbol, marked as a function (FUNC), and a whole list of other symbols. Some of these symbols are like mystery guests (from dynamic libraries) without established memory addresses. Others are more like permanent residents, with fixed addresses (from static libraries or the same file).
But here’s a plot twist: not all symbols are crucial for the binary to function. In fact, in the shadowy world of malware, these symbols are often stripped away to make reverse engineering a headache for security experts.
Want to see how to strip symbols yourself? Just use this Linux command:
strip -s test
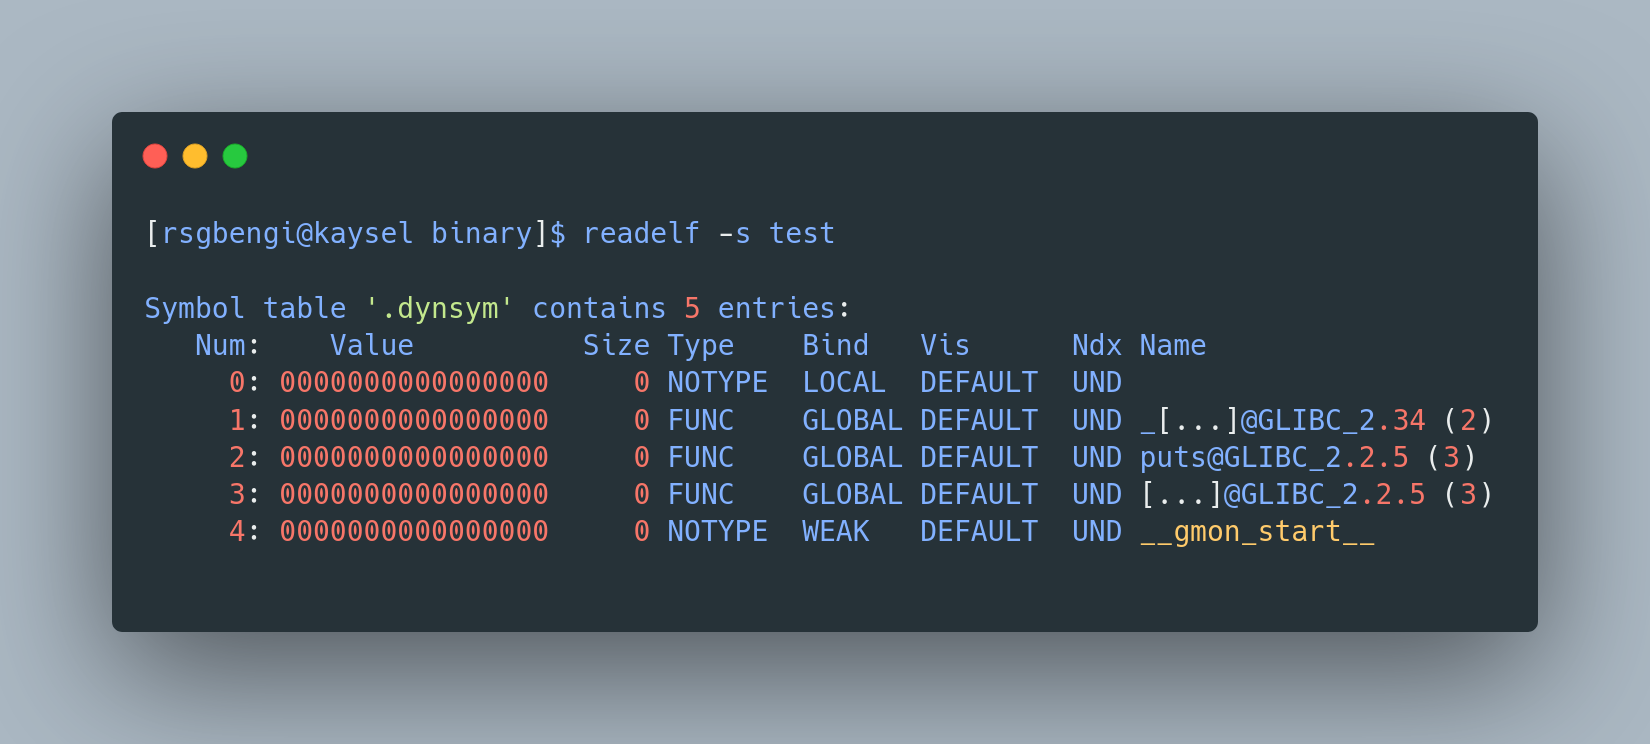
readelf to read the binary after removing the symbols.
After this, if you inspect the file again, you’ll notice a significant part of the previous information is gone, like magic. It’s now labeled as “stripped”, streamlined and a bit more mysterious.
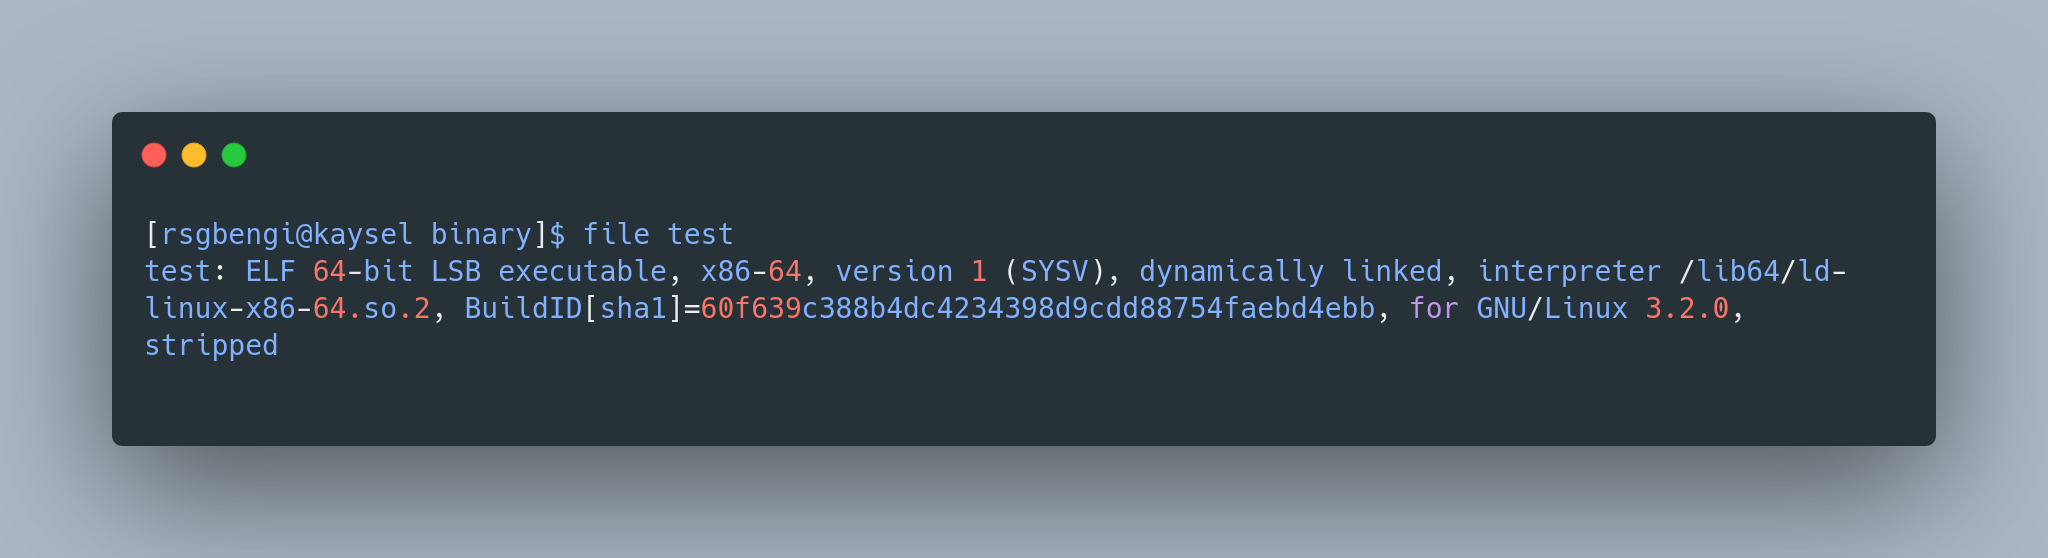
Shows that binary has been stripped of its symbols
Conclusions: Mastering the Art of Compilation
Throughout our journey into the fascinating world of code compilation, we’ve unraveled the mysteries hidden behind each line of C code. From the preprocessing phase, where we set the stage with necessary functions and macros, to the intricate workings of the compilation phase, transforming our code into assembly language, we’ve seen how each step plays a pivotal role in bringing a program to life.
In the assembly phase, our code underwent a remarkable transformation into machine code, resulting in the creation of an object file. This phase highlighted the importance of understanding the low-level aspects of programming and how they contribute to the overall functionality of our applications.
The linking phase was the grand finale where all these compiled pieces came together. We explored the nuances of static and dynamic libraries, understanding their roles and how they impact the final executable. This phase emphasized the importance of efficient memory management and the role of linkers in resolving references to create a cohesive and runnable program.
Moreover, the exploration of symbols revealed the intricacies of how compilers reference functions and variables. We delved into tools like radare2 and readelf, providing a glimpse into the world of reverse engineering and the significance of symbols in understanding and debugging our code.
In essence, this article series has been a deep dive into the art of compilation, equipping you with the knowledge and appreciation of what goes on under the hood of C programming. As we conclude, remember that each phase of compilation is a step towards creating efficient, functional, and robust software. With these insights, you’re now better prepared to navigate the complexities of programming, armed with a deeper understanding and a newfound respect for the compilation process.
References
Introduction - The Official Radare2 Book
Chapters

Previous chapter
Next chapter

💬 Comments Available
Drop your thoughts in the comments below! Found a bug or have feedback? Let me know.